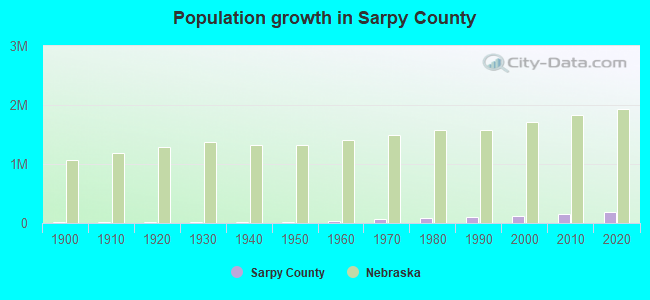
Sarpy County, Nebraska (NE)
County population in 2023: 199,886 (95% urban, 5% rural); it was 122,595 in 2000County owner-occupied with a mortgage or a loan houses and condos in 2020: 38,261County owner-occupied free and clear houses and condos in 2020: 10,553County owner-occupied houses and condos in 2000: 30,058, in 2010: 6,785Renter-occupied apartments: 21,359 (it was 13,368 in 2000, and 16,752 in 2010)% of renters here:
31%State:
30%
Land area: 241 sq. mi.
Water area: 6.8 sq. mi.
Population density: 831 people per square mile (very high).
December 2024 cost of living index in Sarpy County: 90.7 (less than average, U.S. average is 100) Industries providing employment: Educational, health and social services (24.0%), Professional, scientific, management, administrative, and waste management services (12.3%), Finance, insurance, real estate, and rental and leasing (10.2%).
Type of workers:
Private wage or salary: 77%Government: 20%Self-employed, not incorporated: 4%Unpaid family work: 0%
OSM Map
General Map
Google Map
MSN Map
OSM Map
General Map
Google Map
MSN Map
OSM Map
General Map
Google Map
MSN Map
OSM Map
General Map
Google Map
MSN Map
Please wait while loading the map...
Data:
Median household income ($)
Median household income (% change since 2000)
Household income diversity
Ratio of average income to average house value (%)
Ratio of average income to average rent
Median household income ($) - White
Median household income ($) - Black or African American
Median household income ($) - Asian
Median household income ($) - Hispanic or Latino
Median household income ($) - American Indian and Alaska Native
Median household income ($) - Multirace
Median household income ($) - Other Race
Median household income for houses/condos with a mortgage ($)
Median household income for apartments without a mortgage ($)
Races - White alone (%)
Races - White alone (% change since 2000)
Races - Black alone (%)
Races - Black alone (% change since 2000)
Races - American Indian alone (%)
Races - American Indian alone (% change since 2000)
Races - Asian alone (%)
Races - Asian alone (% change since 2000)
Races - Hispanic (%)
Races - Hispanic (% change since 2000)
Races - Native Hawaiian and Other Pacific Islander alone (%)
Races - Native Hawaiian and Other Pacific Islander alone (% change since 2000)
Races - Two or more races (%)
Races - Two or more races (% change since 2000)
Races - Other race alone (%)
Races - Other race alone (% change since 2000)
Racial diversity
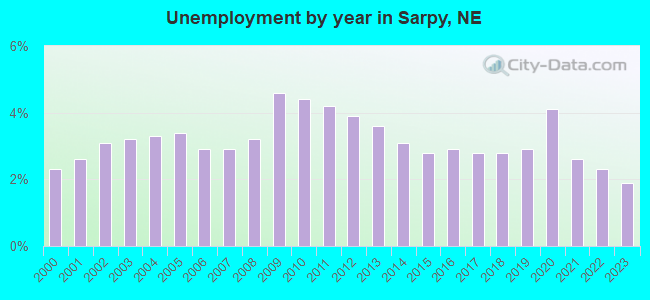
Unemployment (%)
Unemployment (% change since 2000)
Unemployment (%) - White
Unemployment (%) - Black or African American
Unemployment (%) - Asian
Unemployment (%) - Hispanic or Latino
Unemployment (%) - American Indian and Alaska Native
Unemployment (%) - Multirace
Unemployment (%) - Other Race
Population density (people per square mile)
Population - Males (%)
Population - Females (%)
Population - Males (%) - White
Population - Males (%) - Black or African American
Population - Males (%) - Asian
Population - Males (%) - Hispanic or Latino
Population - Males (%) - American Indian and Alaska Native
Population - Males (%) - Multirace
Population - Males (%) - Other Race
Population - Females (%) - White
Population - Females (%) - Black or African American
Population - Females (%) - Asian
Population - Females (%) - Hispanic or Latino
Population - Females (%) - American Indian and Alaska Native
Population - Females (%) - Multirace
Population - Females (%) - Other Race
Coronavirus confirmed cases (Feb 23, 2026)
Deaths caused by coronavirus (Feb 23, 2026)
Coronavirus confirmed cases (per 100k population) (Feb 23, 2026)
Deaths caused by coronavirus (per 100k population) (Feb 23, 2026)
Daily increase in number of cases (Feb 23, 2026)
Weekly increase in number of cases (Feb 23, 2026)
Cases doubled (in days) (Feb 23, 2026)
Hospitalized patients (Apr 18, 2022)
Negative test results (Apr 18, 2022)
Total test results (Apr 18, 2022)
COVID Vaccine doses distributed (per 100k population) (Sep 19, 2023)
COVID Vaccine doses administered (per 100k population) (Sep 19, 2023)
COVID Vaccine doses distributed (Sep 19, 2023)
COVID Vaccine doses administered (Sep 19, 2023)
Likely homosexual households (%)
Likely homosexual households (% change since 2000)
Likely homosexual households - Lesbian couples (%)
Likely homosexual households - Lesbian couples (% change since 2000)
Likely homosexual households - Gay men (%)
Likely homosexual households - Gay men (% change since 2000)
Cost of living index
Median gross rent ($)
Median contract rent ($)
Median monthly housing costs ($)
Median house or condo value ($)
Median house or condo value ($ change since 2000)
Mean house or condo value by units in structure - 1, detached ($)
Mean house or condo value by units in structure - 1, attached ($)
Mean house or condo value by units in structure - 2 ($)
Mean house or condo value by units in structure by units in structure - 3 or 4 ($)
Mean house or condo value by units in structure - 5 or more ($)
Mean house or condo value by units in structure - Boat, RV, van, etc. ($)
Mean house or condo value by units in structure - Mobile home ($)
Median house or condo value ($) - White
Median house or condo value ($) - Black or African American
Median house or condo value ($) - Asian
Median house or condo value ($) - Hispanic or Latino
Median house or condo value ($) - American Indian and Alaska Native
Median house or condo value ($) - Multirace
Median house or condo value ($) - Other Race
Median resident age
Resident age diversity
Median resident age - Males
Median resident age - Females
Median resident age - White
Median resident age - Black or African American
Median resident age - Asian
Median resident age - Hispanic or Latino
Median resident age - American Indian and Alaska Native
Median resident age - Multirace
Median resident age - Other Race
Median resident age - Males - White
Median resident age - Males - Black or African American
Median resident age - Males - Asian
Median resident age - Males - Hispanic or Latino
Median resident age - Males - American Indian and Alaska Native
Median resident age - Males - Multirace
Median resident age - Males - Other Race
Median resident age - Females - White
Median resident age - Females - Black or African American
Median resident age - Females - Asian
Median resident age - Females - Hispanic or Latino
Median resident age - Females - American Indian and Alaska Native
Median resident age - Females - Multirace
Median resident age - Females - Other Race
Commute - mean travel time to work (minutes)
Travel time to work - Less than 5 minutes (%)
Travel time to work - Less than 5 minutes (% change since 2000)
Travel time to work - 5 to 9 minutes (%)
Travel time to work - 5 to 9 minutes (% change since 2000)
Travel time to work - 10 to 19 minutes (%)
Travel time to work - 10 to 19 minutes (% change since 2000)
Travel time to work - 20 to 29 minutes (%)
Travel time to work - 20 to 29 minutes (% change since 2000)
Travel time to work - 30 to 39 minutes (%)
Travel time to work - 30 to 39 minutes (% change since 2000)
Travel time to work - 40 to 59 minutes (%)
Travel time to work - 40 to 59 minutes (% change since 2000)
Travel time to work - 60 to 89 minutes (%)
Travel time to work - 60 to 89 minutes (% change since 2000)
Travel time to work - 90 or more minutes (%)
Travel time to work - 90 or more minutes (% change since 2000)
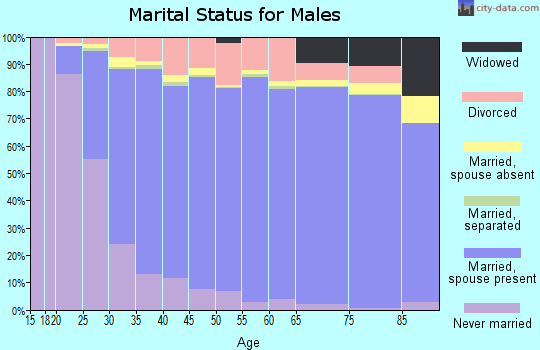
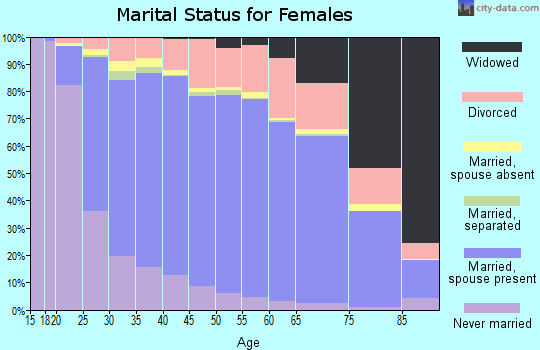
Marital status - Never married (%)
Marital status - Now married (%)
Marital status - Separated (%)
Marital status - Widowed (%)
Marital status - Divorced (%)
Median family income ($)
Median family income (% change since 2000)
Median non-family income ($)
Median non-family income (% change since 2000)
Median per capita income ($)
Median per capita income (% change since 2000)
Median family income ($) - White
Median family income ($) - Black or African American
Median family income ($) - Asian
Median family income ($) - Hispanic or Latino
Median family income ($) - American Indian and Alaska Native
Median family income ($) - Multirace
Median family income ($) - Other Race
Median year house/condo built
Median year apartment built
Year house built - Built 2005 or later (%)
Year house built - Built 2000 to 2004 (%)
Year house built - Built 1990 to 1999 (%)
Year house built - Built 1980 to 1989 (%)
Year house built - Built 1970 to 1979 (%)
Year house built - Built 1960 to 1969 (%)
Year house built - Built 1950 to 1959 (%)
Year house built - Built 1940 to 1949 (%)
Year house built - Built 1939 or earlier (%)
Average household size
Household density (households per square mile)
Average household size - White
Average household size - Black or African American
Average household size - Asian
Average household size - Hispanic or Latino
Average household size - American Indian and Alaska Native
Average household size - Multirace
Average household size - Other Race
Occupied housing units (%)
Vacant housing units (%)
Owner occupied housing units (%)
Renter occupied housing units (%)
Vacancy status - For rent (%)
Vacancy status - For sale only (%)
Vacancy status - Rented or sold, not occupied (%)
Vacancy status - For seasonal, recreational, or occasional use (%)
Vacancy status - For migrant workers (%)
Vacancy status - Other vacant (%)
Residents with income below the poverty level (%)
Residents with income below 50% of the poverty level (%)
Children below poverty level (%)
Poor families by family type - Married-couple family (%)
Poor families by family type - Male, no wife present (%)
Poor families by family type - Female, no husband present (%)
Poverty status for native-born residents (%)
Poverty status for foreign-born residents (%)
Poverty among high school graduates not in families (%)
Poverty among people who did not graduate high school not in families (%)
Residents with income below the poverty level (%) - White
Residents with income below the poverty level (%) - Black or African American
Residents with income below the poverty level (%) - Asian
Residents with income below the poverty level (%) - Hispanic or Latino
Residents with income below the poverty level (%) - American Indian and Alaska Native
Residents with income below the poverty level (%) - Multirace
Residents with income below the poverty level (%) - Other Race
Air pollution - Air Quality Index (AQI)
Air pollution - CO
Air pollution - NO2
Air pollution - SO2
Air pollution - Ozone
Air pollution - PM10
Air pollution - PM25
Air pollution - Pb
Crime - Murders per 100,000 population
Crime - Rapes per 100,000 population
Crime - Robberies per 100,000 population
Crime - Assaults per 100,000 population
Crime - Burglaries per 100,000 population
Crime - Thefts per 100,000 population
Crime - Auto thefts per 100,000 population
Crime - Arson per 100,000 population
Crime - City-data.com crime index
Crime - Violent crime index
Crime - Property crime index
Crime - Murders per 100,000 population (5 year average)
Crime - Rapes per 100,000 population (5 year average)
Crime - Robberies per 100,000 population (5 year average)
Crime - Assaults per 100,000 population (5 year average)
Crime - Burglaries per 100,000 population (5 year average)
Crime - Thefts per 100,000 population (5 year average)
Crime - Auto thefts per 100,000 population (5 year average)
Crime - Arson per 100,000 population (5 year average)
Crime - City-data.com crime index (5 year average)
Crime - Violent crime index (5 year average)
Crime - Property crime index (5 year average)
1996 Presidential Elections Results (%) - Democratic Party (Clinton)
1996 Presidential Elections Results (%) - Republican Party (Dole)
1996 Presidential Elections Results (%) - Other
2000 Presidential Elections Results (%) - Democratic Party (Gore)
2000 Presidential Elections Results (%) - Republican Party (Bush)
2000 Presidential Elections Results (%) - Other
2004 Presidential Elections Results (%) - Democratic Party (Kerry)
2004 Presidential Elections Results (%) - Republican Party (Bush)
2004 Presidential Elections Results (%) - Other
2008 Presidential Elections Results (%) - Democratic Party (Obama)
2008 Presidential Elections Results (%) - Republican Party (McCain)
2008 Presidential Elections Results (%) - Other
2012 Presidential Elections Results (%) - Democratic Party (Obama)
2012 Presidential Elections Results (%) - Republican Party (Romney)
2012 Presidential Elections Results (%) - Other
2016 Presidential Elections Results (%) - Democratic Party (Clinton)
2016 Presidential Elections Results (%) - Republican Party (Trump)
2016 Presidential Elections Results (%) - Other
2020 Presidential Elections Results (%) - Democratic Party (Biden)
2020 Presidential Elections Results (%) - Republican Party (Trump)
2020 Presidential Elections Results (%) - Other
Ancestries Reported - Arab (%)
Ancestries Reported - Czech (%)
Ancestries Reported - Danish (%)
Ancestries Reported - Dutch (%)
Ancestries Reported - English (%)
Ancestries Reported - French (%)
Ancestries Reported - French Canadian (%)
Ancestries Reported - German (%)
Ancestries Reported - Greek (%)
Ancestries Reported - Hungarian (%)
Ancestries Reported - Irish (%)
Ancestries Reported - Italian (%)
Ancestries Reported - Lithuanian (%)
Ancestries Reported - Norwegian (%)
Ancestries Reported - Polish (%)
Ancestries Reported - Portuguese (%)
Ancestries Reported - Russian (%)
Ancestries Reported - Scotch-Irish (%)
Ancestries Reported - Scottish (%)
Ancestries Reported - Slovak (%)
Ancestries Reported - Subsaharan African (%)
Ancestries Reported - Swedish (%)
Ancestries Reported - Swiss (%)
Ancestries Reported - Ukrainian (%)
Ancestries Reported - United States (%)
Ancestries Reported - Welsh (%)
Ancestries Reported - West Indian (%)
Ancestries Reported - Other (%)
Educational Attainment - No schooling completed (%)
Educational Attainment - Less than high school (%)
Educational Attainment - High school or equivalent (%)
Educational Attainment - Less than 1 year of college (%)
Educational Attainment - 1 or more years of college (%)
Educational Attainment - Associate degree (%)
Educational Attainment - Bachelor's degree (%)
Educational Attainment - Master's degree (%)
Educational Attainment - Professional school degree (%)
Educational Attainment - Doctorate degree (%)
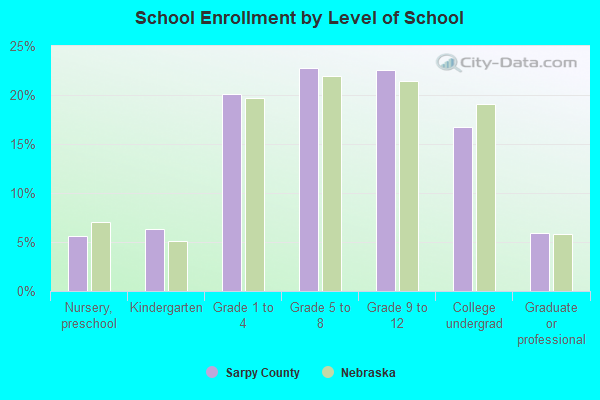
School Enrollment - Nursery, preschool (%)
School Enrollment - Kindergarten (%)
School Enrollment - Grade 1 to 4 (%)
School Enrollment - Grade 5 to 8 (%)
School Enrollment - Grade 9 to 12 (%)
School Enrollment - College undergrad (%)
School Enrollment - Graduate or professional (%)
School Enrollment - Not enrolled in school (%)
School enrollment - Public schools (%)
School enrollment - Private schools (%)
School enrollment - Not enrolled (%)
Median number of rooms in houses and condos
Median number of rooms in apartments
Housing units lacking complete plumbing facilities (%)
Housing units lacking complete kitchen facilities (%)
Density of houses
Urban houses (%)
Rural houses (%)
Households with people 60 years and over (%)
Households with people 65 years and over (%)
Households with people 75 years and over (%)
Households with one or more nonrelatives (%)
Households with no nonrelatives (%)
Population in households (%)
Family households (%)
Nonfamily households (%)
Population in families (%)
Family households with own children (%)
Median number of bedrooms in owner occupied houses
Mean number of bedrooms in owner occupied houses
Median number of bedrooms in renter occupied houses
Mean number of bedrooms in renter occupied houses
Median number of vehichles in owner occupied houses
Mean number of vehichles in owner occupied houses
Median number of vehichles in renter occupied houses
Mean number of vehichles in renter occupied houses
Mortgage status - with mortgage (%)
Mortgage status - with second mortgage (%)
Mortgage status - with home equity loan (%)
Mortgage status - with both second mortgage and home equity loan (%)
Mortgage status - without a mortgage (%)
Average family size
Average family size - White
Average family size - Black or African American
Average family size - Asian
Average family size - Hispanic or Latino
Average family size - American Indian and Alaska Native
Average family size - Multirace
Average family size - Other Race
Geographical mobility - Same house 1 year ago (%)
Geographical mobility - Moved within same county (%)
Geographical mobility - Moved from different county within same state (%)
Geographical mobility - Moved from different state (%)
Geographical mobility - Moved from abroad (%)
Place of birth - Born in state of residence (%)
Place of birth - Born in other state (%)
Place of birth - Native, outside of US (%)
Place of birth - Foreign born (%)
Housing units in structures - 1, detached (%)
Housing units in structures - 1, attached (%)
Housing units in structures - 2 (%)
Housing units in structures - 3 or 4 (%)
Housing units in structures - 5 to 9 (%)
Housing units in structures - 10 to 19 (%)
Housing units in structures - 20 to 49 (%)
Housing units in structures - 50 or more (%)
Housing units in structures - Mobile home (%)
Housing units in structures - Boat, RV, van, etc. (%)
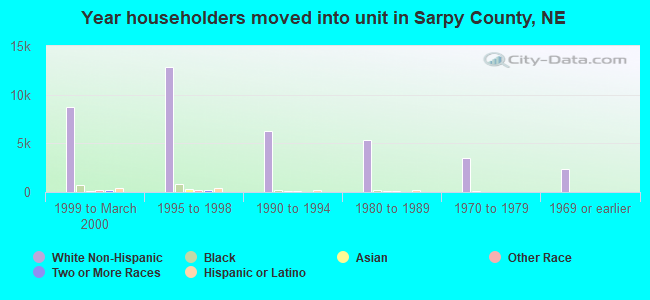
House/condo owner moved in on average (years ago)
Renter moved in on average (years ago)
Year householder moved into unit - Moved in 1999 to March 2000 (%)
Year householder moved into unit - Moved in 1995 to 1998 (%)
Year householder moved into unit - Moved in 1990 to 1994 (%)
Year householder moved into unit - Moved in 1980 to 1989 (%)
Year householder moved into unit - Moved in 1970 to 1979 (%)
Year householder moved into unit - Moved in 1969 or earlier (%)
Means of transportation to work - Drove car alone (%)
Means of transportation to work - Carpooled (%)
Means of transportation to work - Public transportation (%)
Means of transportation to work - Bus or trolley bus (%)
Means of transportation to work - Streetcar or trolley car (%)
Means of transportation to work - Subway or elevated (%)
Means of transportation to work - Railroad (%)
Means of transportation to work - Ferryboat (%)
Means of transportation to work - Taxicab (%)
Means of transportation to work - Motorcycle (%)
Means of transportation to work - Bicycle (%)
Means of transportation to work - Walked (%)
Means of transportation to work - Other means (%)
Working at home (%)
Industry diversity
Most Common Industries - Agriculture, forestry, fishing and hunting, and mining (%)
Most Common Industries - Agriculture, forestry, fishing and hunting (%)
Most Common Industries - Mining, quarrying, and oil and gas extraction (%)
Most Common Industries - Construction (%)
Most Common Industries - Manufacturing (%)
Most Common Industries - Wholesale trade (%)
Most Common Industries - Retail trade (%)
Most Common Industries - Transportation and warehousing, and utilities (%)
Most Common Industries - Transportation and warehousing (%)
Most Common Industries - Utilities (%)
Most Common Industries - Information (%)
Most Common Industries - Finance and insurance, and real estate and rental and leasing (%)
Most Common Industries - Finance and insurance (%)
Most Common Industries - Real estate and rental and leasing (%)
Most Common Industries - Professional, scientific, and management, and administrative and waste management services (%)
Most Common Industries - Professional, scientific, and technical services (%)
Most Common Industries - Management of companies and enterprises (%)
Most Common Industries - Administrative and support and waste management services (%)
Most Common Industries - Educational services, and health care and social assistance (%)
Most Common Industries - Educational services (%)
Most Common Industries - Health care and social assistance (%)
Most Common Industries - Arts, entertainment, and recreation, and accommodation and food services (%)
Most Common Industries - Arts, entertainment, and recreation (%)
Most Common Industries - Accommodation and food services (%)
Most Common Industries - Other services, except public administration (%)
Most Common Industries - Public administration (%)
Occupation diversity
Most Common Occupations - Management, business, science, and arts occupations (%)
Most Common Occupations - Management, business, and financial occupations (%)
Most Common Occupations - Management occupations (%)
Most Common Occupations - Business and financial operations occupations (%)
Most Common Occupations - Computer, engineering, and science occupations (%)
Most Common Occupations - Computer and mathematical occupations (%)
Most Common Occupations - Architecture and engineering occupations (%)
Most Common Occupations - Life, physical, and social science occupations (%)
Most Common Occupations - Education, legal, community service, arts, and media occupations (%)
Most Common Occupations - Community and social service occupations (%)
Most Common Occupations - Legal occupations (%)
Most Common Occupations - Education, training, and library occupations (%)
Most Common Occupations - Arts, design, entertainment, sports, and media occupations (%)
Most Common Occupations - Healthcare practitioners and technical occupations (%)
Most Common Occupations - Health diagnosing and treating practitioners and other technical occupations (%)
Most Common Occupations - Health technologists and technicians (%)
Most Common Occupations - Service occupations (%)
Most Common Occupations - Healthcare support occupations (%)
Most Common Occupations - Protective service occupations (%)
Most Common Occupations - Fire fighting and prevention, and other protective service workers including supervisors (%)
Most Common Occupations - Law enforcement workers including supervisors (%)
Most Common Occupations - Food preparation and serving related occupations (%)
Most Common Occupations - Building and grounds cleaning and maintenance occupations (%)
Most Common Occupations - Personal care and service occupations (%)
Most Common Occupations - Sales and office occupations (%)
Most Common Occupations - Sales and related occupations (%)
Most Common Occupations - Office and administrative support occupations (%)
Most Common Occupations - Natural resources, construction, and maintenance occupations (%)
Most Common Occupations - Farming, fishing, and forestry occupations (%)
Most Common Occupations - Construction and extraction occupations (%)
Most Common Occupations - Installation, maintenance, and repair occupations (%)
Most Common Occupations - Production, transportation, and material moving occupations (%)
Most Common Occupations - Production occupations (%)
Most Common Occupations - Transportation occupations (%)
Most Common Occupations - Material moving occupations (%)
People in Group quarters - Institutionalized population (%)
People in Group quarters - Correctional institutions (%)
People in Group quarters - Federal prisons and detention centers (%)
People in Group quarters - Halfway houses (%)
People in Group quarters - Local jails and other confinement facilities (including police lockups) (%)
People in Group quarters - Military disciplinary barracks (%)
People in Group quarters - State prisons (%)
People in Group quarters - Other types of correctional institutions (%)
People in Group quarters - Nursing homes (%)
People in Group quarters - Hospitals/wards, hospices, and schools for the handicapped (%)
People in Group quarters - Hospitals/wards and hospices for chronically ill (%)
People in Group quarters - Hospices or homes for chronically ill (%)
People in Group quarters - Military hospitals or wards for chronically ill (%)
People in Group quarters - Other hospitals or wards for chronically ill (%)
People in Group quarters - Hospitals or wards for drug/alcohol abuse (%)
People in Group quarters - Mental (Psychiatric) hospitals or wards (%)
People in Group quarters - Schools, hospitals, or wards for the mentally retarded (%)
People in Group quarters - Schools, hospitals, or wards for the physically handicapped (%)
People in Group quarters - Institutions for the deaf (%)
People in Group quarters - Institutions for the blind (%)
People in Group quarters - Orthopedic wards and institutions for the physically handicapped (%)
People in Group quarters - Wards in general hospitals for patients who have no usual home elsewhere (%)
People in Group quarters - Wards in military hospitals for patients who have no usual home elsewhere (%)
People in Group quarters - Juvenile institutions (%)
People in Group quarters - Long-term care (%)
People in Group quarters - Homes for abused, dependent, and neglected children (%)
People in Group quarters - Residential treatment centers for emotionally disturbed children (%)
People in Group quarters - Training schools for juvenile delinquents (%)
People in Group quarters - Short-term care, detention or diagnostic centers for delinquent children (%)
People in Group quarters - Type of juvenile institution unknown (%)
People in Group quarters - Noninstitutionalized population (%)
People in Group quarters - College dormitories (includes college quarters off campus) (%)
People in Group quarters - Military quarters (%)
People in Group quarters - On base (%)
People in Group quarters - Barracks, unaccompanied personnel housing (UPH), (Enlisted/Officer), ;and similar group living quarters for military personnel (%)
People in Group quarters - Transient quarters for temporary residents (%)
People in Group quarters - Military ships (%)
People in Group quarters - Group homes (%)
People in Group quarters - Homes or halfway houses for drug/alcohol abuse (%)
People in Group quarters - Homes for the mentally ill (%)
People in Group quarters - Homes for the mentally retarded (%)
People in Group quarters - Homes for the physically handicapped (%)
People in Group quarters - Other group homes (%)
People in Group quarters - Religious group quarters (%)
People in Group quarters - Dormitories (%)
People in Group quarters - Agriculture workers' dormitories on farms (%)
People in Group quarters - Job Corps and vocational training facilities (%)
People in Group quarters - Other workers' dormitories (%)
People in Group quarters - Crews of maritime vessels (%)
People in Group quarters - Other nonhousehold living situations (%)
People in Group quarters - Other noninstitutional group quarters (%)
Residents speaking English at home (%)
Residents speaking English at home - Born in the United States (%)
Residents speaking English at home - Native, born elsewhere (%)
Residents speaking English at home - Foreign born (%)
Residents speaking Spanish at home (%)
Residents speaking Spanish at home - Born in the United States (%)
Residents speaking Spanish at home - Native, born elsewhere (%)
Residents speaking Spanish at home - Foreign born (%)
Residents speaking other language at home (%)
Residents speaking other language at home - Born in the United States (%)
Residents speaking other language at home - Native, born elsewhere (%)
Residents speaking other language at home - Foreign born (%)
Class of Workers - Employee of private company (%)
Class of Workers - Self-employed in own incorporated business (%)
Class of Workers - Private not-for-profit wage and salary workers (%)
Class of Workers - Local government workers (%)
Class of Workers - State government workers (%)
Class of Workers - Federal government workers (%)
Class of Workers - Self-employed workers in own not incorporated business and Unpaid family workers (%)
House heating fuel used in houses and condos - Utility gas (%)
House heating fuel used in houses and condos - Bottled, tank, or LP gas (%)
House heating fuel used in houses and condos - Electricity (%)
House heating fuel used in houses and condos - Fuel oil, kerosene, etc. (%)
House heating fuel used in houses and condos - Coal or coke (%)
House heating fuel used in houses and condos - Wood (%)
House heating fuel used in houses and condos - Solar energy (%)
House heating fuel used in houses and condos - Other fuel (%)
House heating fuel used in houses and condos - No fuel used (%)
House heating fuel used in apartments - Utility gas (%)
House heating fuel used in apartments - Bottled, tank, or LP gas (%)
House heating fuel used in apartments - Electricity (%)
House heating fuel used in apartments - Fuel oil, kerosene, etc. (%)
House heating fuel used in apartments - Coal or coke (%)
House heating fuel used in apartments - Wood (%)
House heating fuel used in apartments - Solar energy (%)
House heating fuel used in apartments - Other fuel (%)
House heating fuel used in apartments - No fuel used (%)
Armed forces status - In Armed Forces (%)
Armed forces status - Civilian (%)
Armed forces status - Civilian - Veteran (%)
Armed forces status - Civilian - Nonveteran (%)
Fatal accidents locations in years 2005-2022
Fatal accidents locations in 2022
Fatal accidents locations in 2021
Fatal accidents locations in 2020
Fatal accidents locations in 2019
Fatal accidents locations in 2018
Fatal accidents locations in 2017
Fatal accidents locations in 2016
Fatal accidents locations in 2015
Fatal accidents locations in 2014
Fatal accidents locations in 2013
Fatal accidents locations in 2012
Fatal accidents locations in 2011
Fatal accidents locations in 2010
Fatal accidents locations in 2009
Fatal accidents locations in 2008
Fatal accidents locations in 2007
Fatal accidents locations in 2006
Fatal accidents locations in 2005
Alcohol use - People drinking some alcohol every month (%)
Alcohol use - People not drinking at all (%)
Alcohol use - Average days/month drinking alcohol
Alcohol use - Average drinks/week
Alcohol use - Average days/year people drink much
Audiometry - Average condition of hearing (%)
Audiometry - People that can hear a whisper from across a quiet room (%)
Audiometry - People that can hear normal voice from across a quiet room (%)
Audiometry - Ears ringing, roaring, buzzing (%)
Audiometry - Had a job exposure to loud noise (%)
Audiometry - Had off-work exposure to loud noise (%)
Blood Pressure & Cholesterol - Has high blood pressure (%)
Blood Pressure & Cholesterol - Checking blood pressure at home (%)
Blood Pressure & Cholesterol - Frequently checking blood cholesterol (%)
Blood Pressure & Cholesterol - Has high cholesterol level (%)
Consumer Behavior - Money monthly spent on food at supermarket/grocery store
Consumer Behavior - Money monthly spent on food at other stores
Consumer Behavior - Money monthly spent on eating out
Consumer Behavior - Money monthly spent on carryout/delivered foods
Consumer Behavior - Income spent on food at supermarket/grocery store (%)
Consumer Behavior - Income spent on food at other stores (%)
Consumer Behavior - Income spent on eating out (%)
Consumer Behavior - Income spent on carryout/delivered foods (%)
Current Health Status - General health condition (%)
Current Health Status - Blood donors (%)
Current Health Status - Has blood ever tested for HIV virus (%)
Current Health Status - Left-handed people (%)
Dermatology - People using sunscreen (%)
Diabetes - Diabetics (%)
Diabetes - Had a blood test for high blood sugar (%)
Diabetes - People taking insulin (%)
Diet Behavior & Nutrition - Diet health (%)
Diet Behavior & Nutrition - Milk product consumption (# of products/month)
Diet Behavior & Nutrition - Meals not home prepared (#/week)
Diet Behavior & Nutrition - Meals from fast food or pizza place (#/week)
Diet Behavior & Nutrition - Ready-to-eat foods (#/month)
Diet Behavior & Nutrition - Frozen meals/pizza (#/month)
Drug Use - People that ever used marijuana or hashish (%)
Drug Use - Ever used hard drugs (%)
Drug Use - Ever used any form of cocaine (%)
Drug Use - Ever used heroin (%)
Drug Use - Ever used methamphetamine (%)
Health Insurance - People covered by health insurance (%)
Kidney Conditions-Urology - Avg. # of times urinating at night
Medical Conditions - People with asthma (%)
Medical Conditions - People with anemia (%)
Medical Conditions - People with psoriasis (%)
Medical Conditions - People with overweight (%)
Medical Conditions - Elderly people having difficulties in thinking or remembering (%)
Medical Conditions - People who ever received blood transfusion (%)
Medical Conditions - People having trouble seeing even with glass/contacts (%)
Medical Conditions - People with arthritis (%)
Medical Conditions - People with gout (%)
Medical Conditions - People with congestive heart failure (%)
Medical Conditions - People with coronary heart disease (%)
Medical Conditions - People with angina pectoris (%)
Medical Conditions - People who ever had heart attack (%)
Medical Conditions - People who ever had stroke (%)
Medical Conditions - People with emphysema (%)
Medical Conditions - People with thyroid problem (%)
Medical Conditions - People with chronic bronchitis (%)
Medical Conditions - People with any liver condition (%)
Medical Conditions - People who ever had cancer or malignancy (%)
Mental Health - People who have little interest in doing things (%)
Mental Health - People feeling down, depressed, or hopeless (%)
Mental Health - People who have trouble sleeping or sleeping too much (%)
Mental Health - People feeling tired or having little energy (%)
Mental Health - People with poor appetite or overeating (%)
Mental Health - People feeling bad about themself (%)
Mental Health - People who have trouble concentrating on things (%)
Mental Health - People moving or speaking slowly or too fast (%)
Mental Health - People having thoughts they would be better off dead (%)
Oral Health - Average years since last visit a dentist
Oral Health - People embarrassed because of mouth (%)
Oral Health - People with gum disease (%)
Oral Health - General health of teeth and gums (%)
Oral Health - Average days a week using dental floss/device
Oral Health - Average days a week using mouthwash for dental problem
Oral Health - Average number of teeth
Pesticide Use - Households using pesticides to control insects (%)
Pesticide Use - Households using pesticides to kill weeds (%)
Physical Activity - People doing vigorous-intensity work activities (%)
Physical Activity - People doing moderate-intensity work activities (%)
Physical Activity - People walking or bicycling (%)
Physical Activity - People doing vigorous-intensity recreational activities (%)
Physical Activity - People doing moderate-intensity recreational activities (%)
Physical Activity - Average hours a day doing sedentary activities
Physical Activity - Average hours a day watching TV or videos
Physical Activity - Average hours a day using computer
Physical Functioning - People having limitations keeping them from working (%)
Physical Functioning - People limited in amount of work they can do (%)
Physical Functioning - People that need special equipment to walk (%)
Physical Functioning - People experiencing confusion/memory problems (%)
Physical Functioning - People requiring special healthcare equipment (%)
Prescription Medications - Average number of prescription medicines taking
Preventive Aspirin Use - Adults 40+ taking low-dose aspirin (%)
Reproductive Health - Vaginal deliveries (%)
Reproductive Health - Cesarean deliveries (%)
Reproductive Health - Deliveries resulted in a live birth (%)
Reproductive Health - Pregnancies resulted in a delivery (%)
Reproductive Health - Women breastfeeding newborns (%)
Reproductive Health - Women that had a hysterectomy (%)
Reproductive Health - Women that had both ovaries removed (%)
Reproductive Health - Women that have ever taken birth control pills (%)
Reproductive Health - Women taking birth control pills (%)
Reproductive Health - Women that have ever used Depo-Provera or injectables (%)
Reproductive Health - Women that have ever used female hormones (%)
Sexual Behavior - People 18+ that ever had sex (vaginal, anal, or oral) (%)
Sexual Behavior - Males 18+ that ever had vaginal sex with a woman (%)
Sexual Behavior - Males 18+ that ever performed oral sex on a woman (%)
Sexual Behavior - Males 18+ that ever had anal sex with a woman (%)
Sexual Behavior - Males 18+ that ever had any sex with a man (%)
Sexual Behavior - Females 18+ that ever had vaginal sex with a man (%)
Sexual Behavior - Females 18+ that ever performed oral sex on a man (%)
Sexual Behavior - Females 18+ that ever had anal sex with a man (%)
Sexual Behavior - Females 18+ that ever had any kind of sex with a woman (%)
Sexual Behavior - Average age people first had sex
Sexual Behavior - Average number of female sex partners in lifetime (males 18+)
Sexual Behavior - Average number of female vaginal sex partners in lifetime (males 18+)
Sexual Behavior - Average age people first performed oral sex on a woman (18+)
Sexual Behavior - Average number of woman performed oral sex on in lifetime (18+)
Sexual Behavior - Average number of male sex partners in lifetime (males 18+)
Sexual Behavior - Average number of male anal sex partners in lifetime (males 18+)
Sexual Behavior - Average age people first performed oral sex on a man (18+)
Sexual Behavior - Average number of male oral sex partners in lifetime (18+)
Sexual Behavior - People using protection when performing oral sex (%)
Sexual Behavior - Average number of times people have vaginal or anal sex a year
Sexual Behavior - People having sex without condom (%)
Sexual Behavior - Average number of male sex partners in lifetime (females 18+)
Sexual Behavior - Average number of male vaginal sex partners in lifetime (females 18+)
Sexual Behavior - Average number of female sex partners in lifetime (females 18+)
Sexual Behavior - Circumcised males 18+ (%)
Sleep Disorders - Average hours sleeping at night
Sleep Disorders - People that has trouble sleeping (%)
Smoking-Cigarette Use - People smoking cigarettes (%)
Taste & Smell - People 40+ having problems with smell (%)
Taste & Smell - People 40+ having problems with taste (%)
Taste & Smell - People 40+ that ever had wisdom teeth removed (%)
Taste & Smell - People 40+ that ever had tonsils teeth removed (%)
Taste & Smell - People 40+ that ever had a loss of consciousness because of a head injury (%)
Taste & Smell - People 40+ that ever had a broken nose or other serious injury to face or skull (%)
Taste & Smell - People 40+ that ever had two or more sinus infections (%)
Weight - Average height (inches)
Weight - Average weight (pounds)
Weight - Average BMI
Weight - People that are obese (%)
Weight - People that ever were obese (%)
Weight - People trying to lose weight (%)
152,555 76.3% White Non-Hispanic Alone 23,643 11.8% Hispanic or Latino 8,202 4.1% Two or more races 7,238 3.6% Black Non-Hispanic Alone 6,736 3.4% Asian alone 1,305 0.7% Some other race alone 207 0.1% American Indian and Alaska Native alone Males: 100,881 Females: 99,005
Average household size: Sarpy County:
2.7 peopleNebraska:
2.5 people
Estimated median household income in 2023: $101,932 ($53,804 in 1999)This county:
$101,932Nebraska:
$74,590
Median contract rent in 2023 for apartments: $1,226 (lower quartile is $920, upper quartile is $1,578)This county:
$1226State:
$874
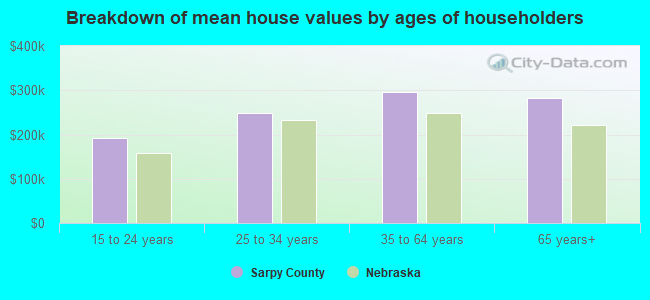
Estimated median house or condo value in 2023: $322,400 (it was $112,000 in 2000 )
Sarpy:
$322,400Nebraska:
$245,200
Lower value quartile - upper value quartile: $238,800 - $422,600Mean price in 2023: Detached houses: $338,304 Here:
$338,304State:
$285,739
Townhouses or other attached units: $259,790 Here:
$259,790State:
$254,756
In 2-unit structures: $146,248 Here:
$146,248State:
$193,533
In 5-or-more-unit structures: $282,488 Here:
$282,488State:
$257,885
Mobile homes: $38,680 Here:
$38,680State:
$84,278
Occupied boats, RVs, vans, etc.: $1,995 Here:
$1,995State:
$121,130
Median monthly housing costs for homes and condos with a mortgage: $2,000Median monthly housing costs for units without a mortgage: $846Institutionalized population: 703
Crime in 2024 (reported by the sheriff's office or county police, not the county total):
Murders: 1
Rapes: 15
Robberies: 4
Assaults: 7
Burglaries: 93
Thefts: 496
Auto thefts: 90
Crime in 2023 (reported by the sheriff's office or county police, not the county total):
Murders: 1
Rapes: 18
Robberies: 5
Assaults: 1
Burglaries: 68
Thefts: 572
Auto thefts: 127
Health of residents in Sarpy County based on CDC Behavioral Risk Factor Surveillance System Survey Questionnaires from 2013 to 2021:
General health status score of residents in this county from 1 (poor) to 5 (excellent) is 3.5. This is about average.
of residents exercised in the past month. This is about average.
of residents smoked 100+ cigarettes in their lives. This is about average.
of adult residents drank alcohol in the past 30 days. This is less than average.
of residents visited a dentist within the past year. This is about average.
Average weight of males is 204 pounds. This is more than average.
Average weight of females is 167 pounds. This is more than average.
Health of residents in Sarpy County based on CDC Behavioral Risk Factor Surveillance System Survey Questionnaires from 2003 to 2012:
General health status score of residents in this county from 1 (poor) to 5 (excellent) is 3.6. This is better than average.
of residents exercised in the past month. This is about average.
of residents smoked 100+ cigarettes in their lives. This is about average.
of adult residents drank alcohol in the past 30 days. This is about average.
of residents visited a dentist within the past year. This is about average.
Average weight of males is 202 pounds. This is more than average.
Average weight of females is 164 pounds. This is about average.
of residents keep firearms around their homes. This is more than average.
Single-family new house construction building permits:
2024: 1198 buildings, average cost: $264,6002023: 952 buildings, average cost: $268,2002022: 796 buildings, average cost: $285,6002021: 1320 buildings, average cost: $277,0002020: 1134 buildings, average cost: $278,5002019: 931 buildings, average cost: $264,8002018: 925 buildings, average cost: $268,8002017: 938 buildings, average cost: $266,3002016: 933 buildings, average cost: $267,5002015: 857 buildings, average cost: $263,4002014: 886 buildings, average cost: $262,8002013: 978 buildings, average cost: $245,3002012: 764 buildings, average cost: $239,8002011: 623 buildings, average cost: $227,2002010: 691 buildings, average cost: $221,2002009: 1116 buildings, average cost: $188,3002008: 1103 buildings, average cost: $207,7002007: 1305 buildings, average cost: $166,4002006: 1482 buildings, average cost: $161,3002005: 1868 buildings, average cost: $151,2002004: 1870 buildings, average cost: $148,7002003: 1839 buildings, average cost: $142,3002002: 1426 buildings, average cost: $126,2002001: 1007 buildings, average cost: $116,4002000: 1127 buildings, average cost: $110,8001999: 1272 buildings, average cost: $109,3001998: 1085 buildings, average cost: $87,7001997: 940 buildings, average cost: $90,000Median real estate property taxes paid for housing units with mortgages in 2023: $5,387 (1.6%)Median real estate property taxes paid for housing units with no mortgage in 2023: $4,809 (1.6%)
Percentage of residents living in poverty in 2023: 4.7%Sarpy County:
4.7%Nebraska:
10.5%
for White Non-Hispanic residents , 14.1% for Black residents , 9.4% for Hispanic or Latino residents , 5.6% for American Indian residents , 11.6% for Native Hawaiian and other Pacific Islander residents , 10.6% for other race residents , 5.5% for two or more races residents )Median age of residents in 2023: 36.0 years oldMales: 35.4 years old, Females: 36.8 years old)Median age for: White residents: 38.3 years old, Black residents: 36.3 years old, American Indian residents: 27.9 years old, Asian residents: 34.3 years old, Hispanic or Latino residents: 25.8 years old, Other race residents: 32.5 years old)
Area name: Omaha-Council Bluffs, NE-IA HUD Metro FMR AreaFair market rent in 2006 for a 1-bedroom apartment in Sarpy County is $531 a month.Fair market rent for a 2-bedroom apartment is $662 a month.Fair market rent for a 3-bedroom apartment is $884 a month.
Sarpy County has a predicted average indoor radon screening level greater than 4 pCi/L (pico curies per liter) - Highest Potential
2025 air pollution in Sarpy County:
Particulate Matter (PM2.5 ) Annual: 7.5 µg/m3 (standard limit: 15.0 µg/m3 ). Near U.S. average.
Notable locations in this county outside city limits:
Notable locations in Sarpy County: (A) , Pappio (B) , Moses Merrill Mission Site (C) , Cornhusker Plaza (D) , Harrison Square (E) , Twin Creek Plaza (F) , Tregaron Golf Course (G) , Platteview Country Club (H) , Nebraska Crossing (I) , Tiburon Golf Club (J) , Linoma Beach Campground (K) , NebraSKI Area Complex (L) , West Omaha KOA (M) , Melia Hill Rest Area (N) , Camp Maha (O) , Crestview Lodge (P) , Eppley Camp (Q) , Ak-Sar-Ben Aquarium (R) , Gretna Fish Hatchery Museum (S) , La Vista Volunteer Fire and Rescue Department District 2 (T) . Display/hide their locations on the map
Churches in Sarpy County include: (A) , Overland Hills Church (B) , Heritage Church of Nazarene (C) , First Southern Baptist Church (D) , Gretna Community Church (E) , Calvary Christian Church (F) , Saint Joseph Church (G) , The Church of Jesus Christ of Latter Day Saints (H) , Saint Marthas Episcopal Church (I) . Display/hide their locations on the map
Cemeteries: (1) , Beth Hamedrosh Hagodel Cemetery (2) , Portal Cemetery (3) , Pennsylvania Cemetery (4) , Fairview Cemetery (5) , Holy Sepulcher Cemetery (6) , LaPlatte Cemetery (7) . Display/hide their locations on the map
Reservoirs: (A) , Papillion Creek Reservoir S-31 (B) , Papillion Creek Reservoir S-32 (C) , Thousand Oaks Lake (D) , Turtle Creek Reservoir 2 (E) , Shadow Lake (F) , Walnut Creek Lake (G) . Display/hide their locations on the map
Streams, rivers, and creeks: (A) , Zwiebel Creek (B) , Walnut Creek (C) , Elkhorn River (D) , Springfield Creek (E) , Papillion Creek (F) , Big Elk Creek (G) , Turtle Creek (H) , Applewood Creek (I) . Display/hide their locations on the map
Parks in Sarpy County include: (1) , Chalco Hills Recreation Area (2) , Leo Royal Memorial Park (3) , Gretna Fish Hatchery Historical Marker (4) , Great Platte Valley Historical Marker (5) , Walnut Creek Recreation Area (6) , Buffalo Park (7) , Leawood Oaks II Park (8) , Fontenelle Forest Nature Center (9) . Display/hide their locations on the map
Unemployment in November 2024: Current college students: 8,803People 25 years of age or older with a high school degree or higher: 95.4%People 25 years of age or older with a bachelor's degree or higher: 41.3%
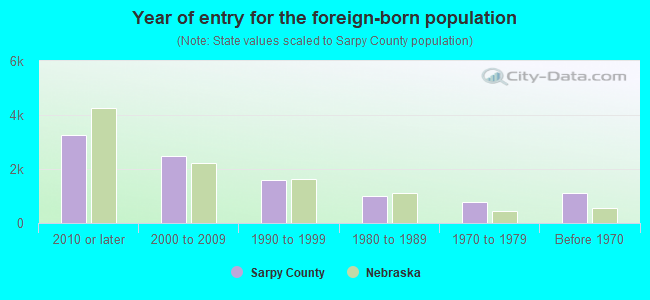
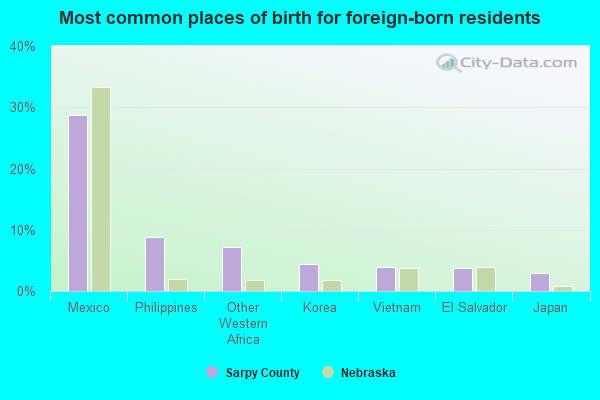
Number of foreign born residents: 13,086 (55.8% naturalized citizens )
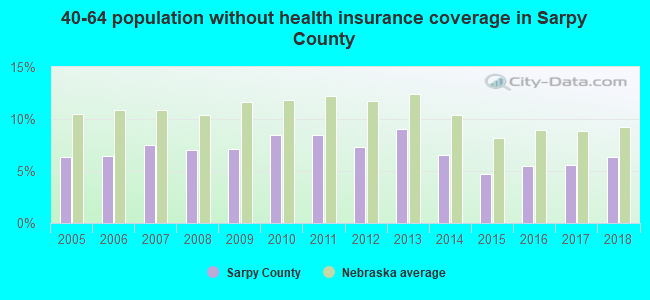
Sarpy County:
6.5%Whole state:
7.7%
Year of entry for the foreign-born population
4,848 2010 or later 2,908 2000 to 2009 1,791 1990 to 1999 1,000 1980 to 1989 765 1970 to 1979 1,119 Before 1970
Mean travel time to work (commute): 21 minutes
Percentage of county residents living and working in this county: 96.5%
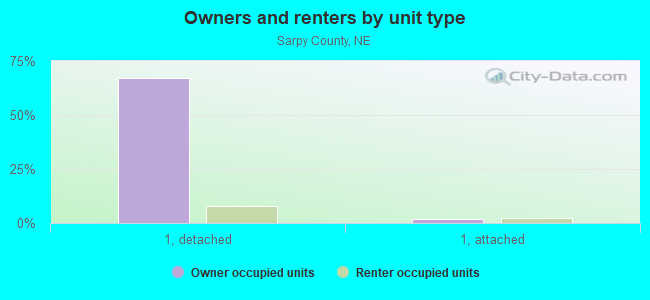
Housing units in structures:
One, detached: 58,690One, attached: 3,653Two: 4923 or 4: 1,1925 to 9: 2,72910 to 19: 4,58920 to 49: 2,81950 or more: 3,929Mobile homes: 441Boats, RVs, vans, etc.: 217
Housing units in Sarpy County with a mortgage: 39,036 (4,024 second mortgage , 37 home equity loan , 2,909 both second mortgage and home equity loan )Houses without a mortgage: 719
Here:
5.1% with mortgage State:
98.1% with mortgage
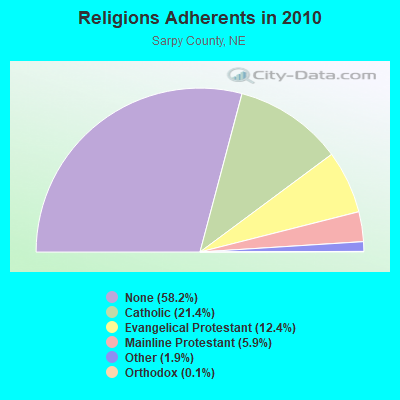
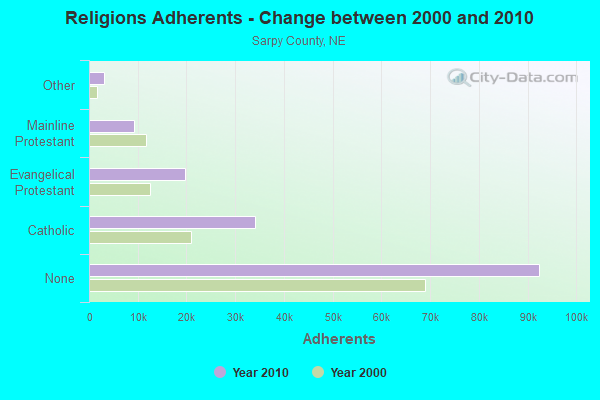
Religion statistics for Sarpy County
Religion Adherents Congregations Catholic 34,059 8 Evangelical Protestant 19,736 54 Mainline Protestant 9,299 17 Other 3,082 10 Orthodox 223 1 None 92,441 -
Sarpy County Religion Details Source: Clifford Grammich, Kirk Hadaway, Richard Houseal, Dale E.Jones, Alexei Krindatch, Richie Stanley and Richard H.Taylor. 2012. 2010 U.S.Religion Census: Religious Congregations & Membership Study. Association of Statisticians of American Religious Bodies. Jones, Dale E., et al. 2002. Congregations and Membership in the United States 2000. Nashville, TN: Glenmary Research Center. Food Environment Statistics: Number of grocery stores : 15Sarpy County :
1.03 / 10,000 pop.State :
2.60 / 10,000 pop.
Number of supercenters and club stores : 2Here :
0.14 / 10,000 pop.Nebraska :
0.21 / 10,000 pop.
Number of convenience stores (no gas) : 4This county :
0.27 / 10,000 pop.Nebraska :
0.44 / 10,000 pop.
Number of convenience stores (with gas) : 46Sarpy County :
3.14 / 10,000 pop.Nebraska :
4.83 / 10,000 pop.
Number of full-service restaurants : 72This county :
4.92 / 10,000 pop.State :
7.76 / 10,000 pop.
Adult diabetes rate : Sarpy County :
7.0%Nebraska :
7.9%
Adult obesity rate : Sarpy County :
28.5%State :
28.0%
Low-income preschool obesity rate : Agriculture in Sarpy County:
Average size of farms: 296 acresAverage value of agricultural products sold per farm: $131,778Average value of crops sold per acre for harvested cropland: $186.59The value of nursery, greenhouse, floriculture, and sod as a percentage of the total market value of agricultural products sold: 6.46%The value of livestock, poultry, and their products as a percentage of the total market value of agricultural products sold: 65.78%Average total farm production expenses per farm: $131,021Harvested cropland as a percentage of land in farms: 81.57%Average market value of all machinery and equipment per farm: $70,567The percentage of farms operated by a family or individual: 86.76%Average age of principal farm operators: 54 yearsAverage number of cattle and calves per 100 acres of all land in farms: 15.75Corn for grain: 39175 harvested acres All wheat for grain: 395 harvested acres Soybeans for beans: 40533 harvested acres Land in orchards: 7 acres Tornado activity:
Sarpy County historical area-adjusted tornado activity is significantly below Nebraska state average. It is 1664205.4 times below overall U.S. average. Tornadoes in this county have caused 3 fatalities and 136 injuries recorded between 1950 and 2024. On 1975-05-06, a category F4 (max. wind speeds 207-260 mph) tornado killed 3 people and injured 133 people and caused between $50,000 and $500,000 in damages.On 2008-06-08, a category F2 (max. wind speeds 113-157 mph) tornado injured 3 people.Earthquake activity:
Sarpy County-area historical earthquake activity is slightly below Nebraska state average. It is 49% smaller than the overall U.S. average. On 9/3/2016 at 12:02:44, a magnitude 5.8 (5.8 MW, Depth: 3.5 mi, Class: Moderate, Intensity: VI - VII) earthquake occurred 329.9 miles away from Sarpy County center On 11/6/2011 at 03:53:10, a magnitude 5.7 (5.7 MW, Depth: 3.2 mi) earthquake occurred 390.1 miles away from the county center On 6/22/2019 at 08:50:24, a magnitude 4.6 (4.6 MW, Depth: 1.9 mi, Class: Light, Intensity: IV - V) earthquake occurred 223.5 miles away from the county center On 11/12/2014 at 21:40:00, a magnitude 4.9 (4.9 MW, Depth: 2.5 mi) earthquake occurred 281.0 miles away from the county center On 11/3/2002 at 20:41:56, a magnitude 4.3 (4.3 MB, Depth: 3.1 mi) earthquake occurred 185.3 miles away from Sarpy County center On 12/8/2021 at 13:45:28, a magnitude 4.3 (4.3 MW, Depth: 1.9 mi) earthquake occurred 187.9 miles away from the county center Magnitude types: body-wave magnitude (MB), moment magnitude (MW) Most recent natural disasters: Nebraska Severe Winter Storm and Straight-line Winds, Incident Period: Mar 18, 2025 - Mar 19, 2025, FEMA Id: 4868, Natural disaster type: Winter Storm, Wind
Nebraska Severe Storms, Straight-line Winds, Tornadoes, and Flooding, Incident Period: Jul 31, 2024, FEMA Id: 4838, Natural disaster type: Storm, Tornado, Flood, Wind
Nebraska Severe Storms, Straight-line Winds, Tornadoes, and Flooding, Incident Period: May 20, 2024 - Jun 3, 2024, FEMA Id: 4808, Natural disaster type: Storm, Tornado, Flood, Wind
Nebraska Severe Storms, Straight-line Winds, and Tornadoes, Incident Period: Dec 15, 2021, FEMA Id: 4641, Natural disaster type: Storm, Tornado, Wind
Nebraska Severe Storms and Straight-line Winds, Incident Period: Jul 9, 2021 - Jul 10, 2021, FEMA Id: 4616, Natural disaster type: Storm, Wind
Nebraska Covid-19, Incident Period: Jan 20, 2020 - May 11, 2023, FEMA Id: 3483, Natural disaster type: Other
Nebraska Covid-19 Pandemic, Incident Period: January 20, 2020, FEMA Id: 4521, Natural disaster type: Other
Nebraska Severe Winter Storm, Straight-line Winds, And Flooding, Incident Period: March 9, 2019 - April 1, 2019, FEMA Id: 4420, Natural disaster type: Winter Storm, Flood, Wind
Nebraska Severe Storms, Tornadoes, And Straight-line Winds, Incident Period: June 12, 2017 - June 17, 2017, FEMA Id: 4325, Natural disaster type: Storm, Tornado, Wind
Nebraska Flooding, Incident Period: June 17, 2011 to August 01, 2011, Emergency Declared EM-3323: June 18, 2011, FEMA Id: 3323, Natural disaster type: Flood
15 other natural disasters have been reported since 1953. The number of natural disasters in Sarpy County (25) is greater than the US average (19).Major Disasters (Presidential) Declared: 14Emergencies Declared: 2Floods: 16, Storms: 14, Tornadoes: 9, Winds: 8, Winter Storms: 3, Snows: 2, Hurricane: 1, Snowstorm: 1, Other: 2 (Note: some incidents may be assigned to more than one category).
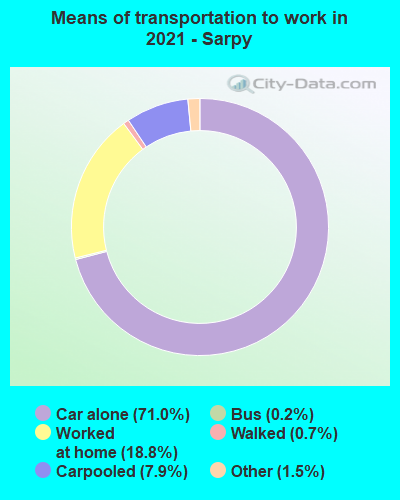
Means of transportation to work:
Drove a car alone : 68,744 (73.5%)Carpooled : 7,429 (7.9%)Bus : 65 (0.1%)Subway or elevated rail : 125 (0.1%)Long-distance train or commuter rail : 9 (0.0%)Taxicab, motorcycle, or other means : 1,164 (1.2%)Bicycle : 77 (0.1%)Walked : 432 (0.5%)Worked at home : 15,473 (16.5%)
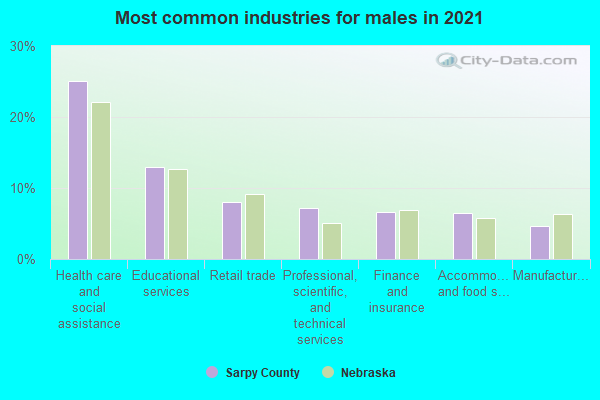
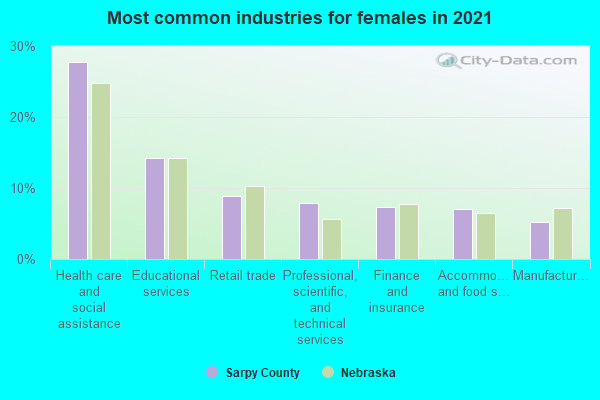
Most common industries in 2023 (%)
Males Females
Health care and social assistance (24%)Educational services (13%)Finance and insurance (11%)Retail trade (7%)Professional, scientific, and technical services (6%)Accommodation and food services (6%)Manufacturing (4%)
Health care and social assistance (27%)Educational services (14%)Finance and insurance (12%)Retail trade (7%)Professional, scientific, and technical services (7%)Accommodation and food services (6%)Manufacturing (5%)
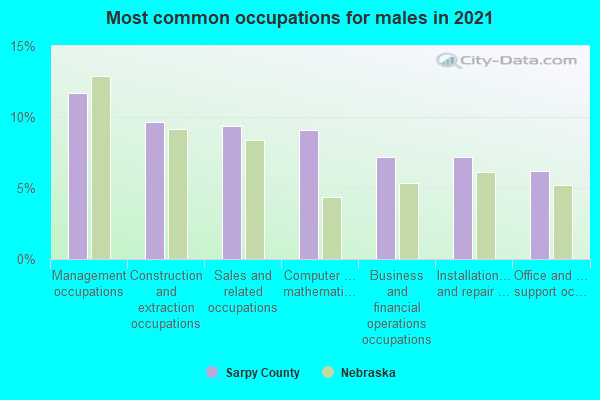
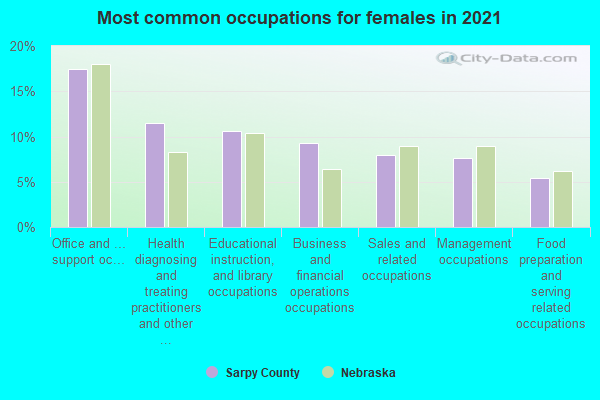
Most common occupations in 2023 (%)
Males Females
Management occupations (15%)Sales and related occupations (10%)Construction and extraction occupations (10%)Office and administrative support occupations (7%)Computer and mathematical occupations (7%)Transportation occupations (6%)Production occupations (5%)
Office and administrative support occupations (14%)Educational instruction, and library occupations (13%)Business and financial operations occupations (11%)Health diagnosing and treating practitioners and other technical occupations (11%)Management occupations (10%)Sales and related occupations (10%)Personal care and service occupations (5%)
Mexico (28%)Vietnam (7%)Philippines (7%)Togo (4%)Colombia (3%)Afghanistan (3%)India (3%)
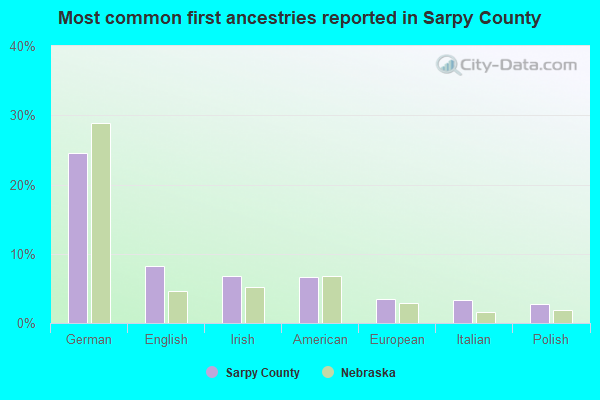
German (24%)English (8%)American (7%)Irish (6%)Italian (3%)European (3%)Polish (3%)
People in group quarters in Sarpy County, Nebraska in 2020:
553 people in nursing facilities/skilled-nursing facilities
295 people in college/university student housing
219 people in military quarters 219 people in military barracks and dormitories (non-disciplinary)
137 people in other noninstitutional facilities 107 people in group homes intended for adults
30 people in other noninstitutional facilities
123 people in correctional facilities for adults 123 people in correctional residential facilities
27 people in juvenile facilities 12 people in group homes for juveniles (non-correctional)
15 people in correctional facilities intended for juveniles
People in group quarters in Sarpy County, Nebraska in 2010:
450 people in nursing facilities/skilled-nursing facilities
443 people in military barracks and dormitories (nondisciplinary)
155 people in local jails and other municipal confinement facilities
94 people in college/university student housing
53 people in group homes intended for adults
39 people in group homes for juveniles (non-correctional)
24 people in correctional facilities intended for juveniles
19 people in other noninstitutional facilities
People in group quarters in Sarpy County, Nebraska in 2000:
558 people in military barracks, etc.
344 people in nursing homes
150 people in local jails and other confinement facilities (including police lockups)
52 people in mental (psychiatric) hospitals or wards
50 people in other noninstitutional group quarters
48 people in homes for the mentally retarded
29 people in college dormitories (includes college quarters off campus)
29 people in military transient quarters for temporary residents
14 people in unknown juvenile institutions
13 people in religious group quarters
10 people in homes for abused, dependent, and neglected children
3 people in agriculture workers' dormitories on farms
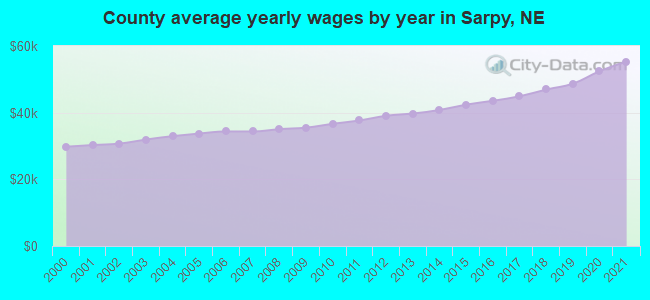
Average gross adjusted income of non-migrant taxpayers in this county in 2021 was $98,950.
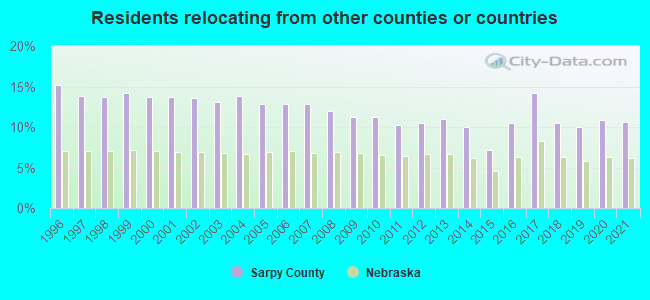
10.28% of this county's 2022 resident taxpayers lived in other counties in 2021 ( $71,487 average adjusted gross income)
Here:
10.28%Nebraska average:
6.14%
0.16% of residents moved from foreign countries ($1,086 average AGI)Sarpy County:
0.16%Nebraska average:
0.02%
relocated from other counties in Nebraska ($41,432 average AGI)relocated from other states ($28,969 average AGI)Sarpy County:
4.02%Nebraska average:
2.59%
Top counties from which taxpayers relocated into this county between 2021 and 2022: from Douglas County, NE from Lancaster County, NE from Pottawattamie County, IA from Cass County, NE from Maricopa County, AZ from El Paso County, CO from Monterey County, CA
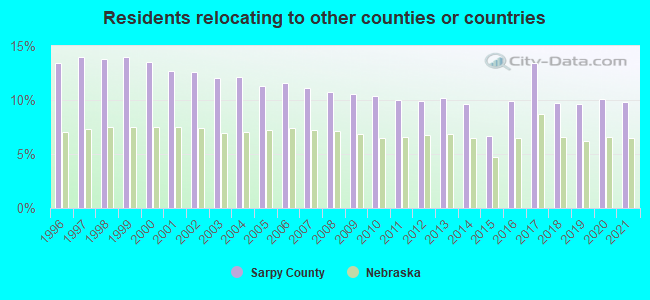
9.19% of this county's 2021 resident taxpayers moved to other counties in 2022 ( $67,214 average adjusted gross income)
Here:
9.19%Nebraska average:
6.29%
0.14% of residents moved to foreign countries ($1,027 average AGI)Sarpy County:
0.14%Nebraska average:
0.02%
relocated to other counties in Nebraska ($34,254 average AGI)relocated to other states ($31,933 average AGI)Sarpy County:
3.90%Nebraska average:
2.76%
Top counties to which taxpayers relocated from this county between 2021 and 2022: to Douglas County, NE to Pottawattamie County, IA to Cass County, NE to Lancaster County, NE to Maricopa County, AZ to Mills County, IA to El Paso County, CO
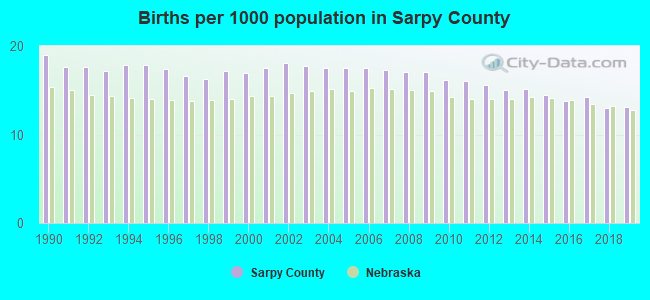
Births per 1000 population from 1990 to 1999: 17.5Births per 1000 population from 2000 to 2009: 17.4Births per 1000 population from 2010 to 2024: 13.8
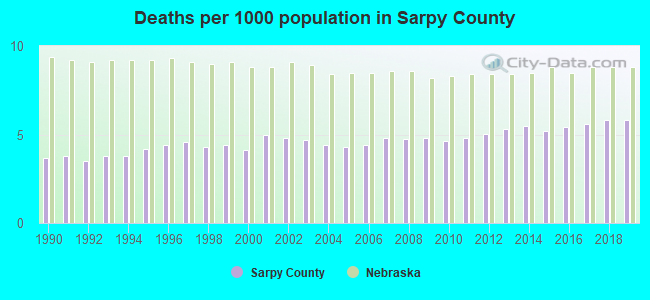
Deaths per 1000 population from 1990 to 1999: 4.0Deaths per 1000 population from 2000 to 2009: 4.6Deaths per 1000 population from 2010 to 2020: 5.5
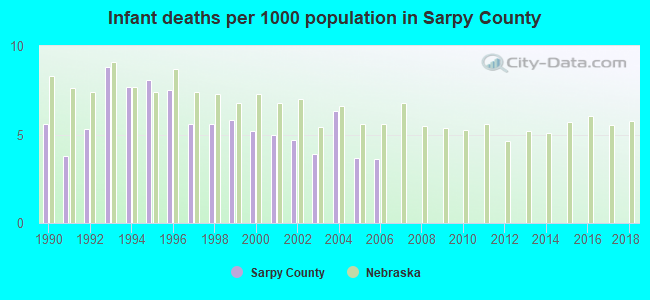
Infant deaths per 1000 live births from 1990 to 1999: 6.4Infant deaths per 1000 live births from 2000 to 2006: 4.6
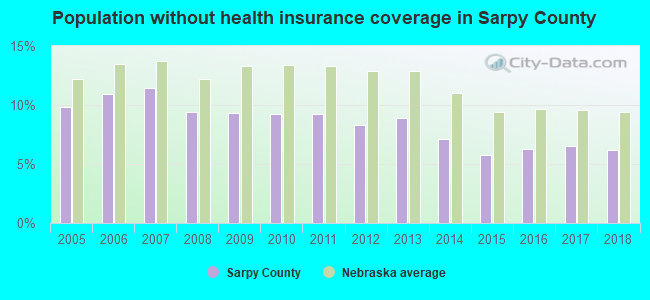
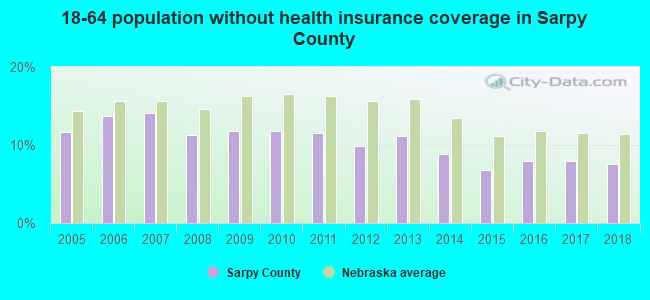
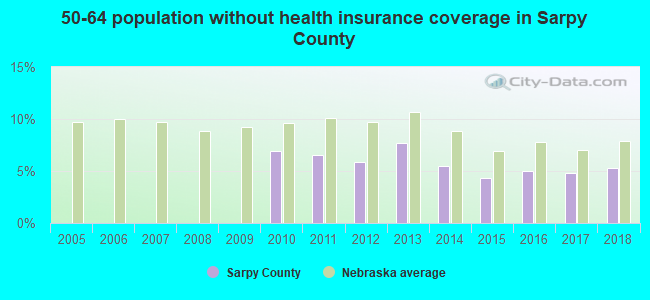
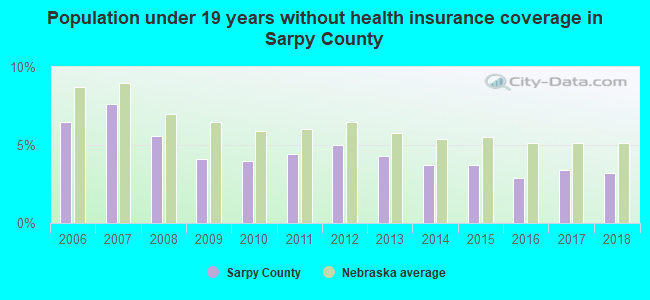
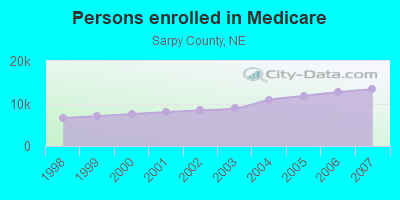
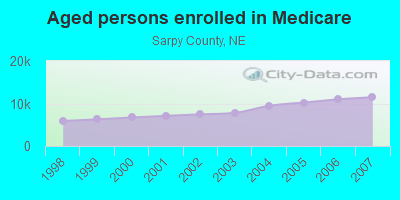
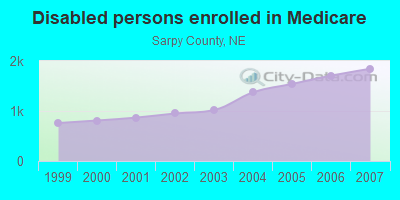
Population without health insurance coverage in 2023: 4.6%Persons under 19 years old without health insurance coverage in 2023: 2.3%Persons enrolled in hospital insurance and/or supplemental medical insurance (Medicare) in July 1, 2007: 13,333 (11,488 aged , 1,845 disabled )Children under 18 without health insurance coverage in 2007: 2,477 (5%)Most common underlying causes of death in Sarpy County, Nebraska in 1999 - 2019:
Atherosclerotic heart disease (1,156)
Bronchus or lung, unspecified - Malignant neoplasms (1,131)
Chronic obstructive pulmonary disease, unspecified (793)
Unspecified dementia (660)
Acute myocardial infarction, unspecified (517)
Alzheimer disease, unspecified (468)
Stroke, not specified as haemorrhage or infarction (394)
Pneumonia, unspecified (347)
Congestive heart failure (339)
Breast, unspecified - Malignant neoplasms (288)
Population without health insurance coverage in 2000: 8%Children under 18 without health insurance coverage in 2000: 5%
Short term general hospitals per 100,000 population in 2004: 0.74Short term general hospital admissions per 100,000 population in 2004: 2,310Short term general hospital beds per 100,000 population in 2004: 74Emergency room visits per 100,000 population in 2004: 12,083General practice office based MDs per 100,000 population in 2005: 1,708Medical specialist MDs per 100,000 population in 2005: 439Dentists per 100,000 population in 1998: 1Total births per 100,000 population, July 2005 - July 2006 : 33Total deaths per 100,000 population, July 2005 - July 2006: 63Limited-service eating places per 100,000 population in 2005 : 11
Suicides per 1,000,000 population from 2000 to 2006: 102.5. This is less than state average.
Deaths per 1,000,000 population:
Firearm - 61.5
Other - 41.0
Household type by relationship:
Households: 199,886
Male householders: 41,365 (9,936 living alone ), Female householders: 34,181 (8,152 living alone )43,362 spouses (42,861 opposite-sex spouses ), 5,025 unmarried partners , (4,875 opposite-sex unmarried partners ), 63,417 children (58,333 natural , 2,636 adopted , 2,448 stepchildren ), 2,190 grandchildren , 1,589 brothers or sisters , 1,963 parents , 59 foster children , 2,200 other relatives , 3,481 non-relatives In group quarters: 1,054
Size of family households: 20,724 2-persons , 12,157 3-persons , 11,786 4-persons , 4,731 5-persons , 2,554 6-persons , 1,383 7-or-more-persons .
Size of nonfamily households: 18,088 1-person , 3,574 2-persons , 306 3-persons , 211 4-persons , 32 5-persons .
39,146 married couples with children. single-parent households (1,637 men , 7,756 women ).
90.5% of residents of Sarpy speak English at home. of residents speak Spanish at home (67% speak English very well , 17% speak English well , 12% speak English not well , 3% don't speak English at all ).of residents speak other Indo-European language at home (83% speak English very well , 13% speak English well , 3% speak English not well ).of residents speak Asian or Pacific Island language at home (63% speak English very well , 26% speak English well , 9% speak English not well , 2% don't speak English at all ).of residents speak other language at home (62% speak English very well , 27% speak English well , 11% speak English not well ).
In fiscal year 2004:
Federal Government expenditure: $1,045,095,000 ($7,686 per capita )Department of Defense expenditure: $787,822,000Federal direct payments to individuals for retirement and disability: $246,734,000Federal other direct payments to individuals: $38,764,000Federal direct payments not to individuals: $3,516,000Federal grants: $54,082,000Federal procurement contracts: $274,773,000 ($268,852,000 Department of Defense )Federal salaries and wages: $427,225,000 ($417,264,000 Department of Defense )Federal Government direct loans: $485,000Federal guaranteed/insured loans: $273,056,000Federal Government insurance: $89,004,000
Population change from April 1, 2000 to July 1, 2005:
Births: 11,861Here:
85 per 1000 residentsState:
75 per 1000 residents
Deaths: 3,227Here:
23 per 1000 residentsState:
46 per 1000 residents
Net international migration: +800Here:
+6 per 1000 residentsState:
+13 per 1000 residents
Net internal migration: +7,508
Here : State :
Total withdrawal of fresh water for public supply: 22.28 millions of gallons per day (all from ground)
Median number of rooms in houses and condos:
Median number of rooms in apartments:
Year house built in Sarpy County, Nebraska
5,132 2020 or later14,665 2010 to 201918,378 2000 to 200910,777 1990 to 19998,381 1980 to 19899,421 1970 to 19796,741 1960 to 19692,925 1950 to 19591,013 1940 to 19491,318 1939 or earlier
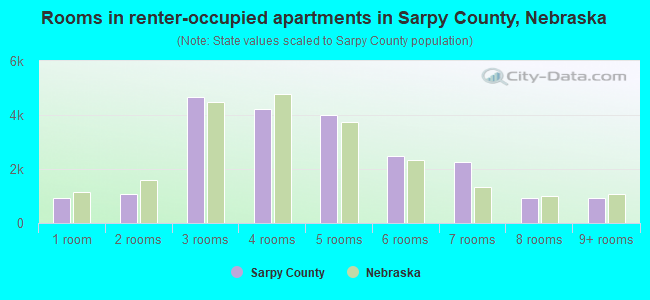
Rooms in houses/apartments in Sarpy County, Nebraska
Owner-occupied Renter-occupied
Rooms in owner-occupied houses in Sarpy County, Nebraska
217 1 room 0 2 rooms 433 3 rooms 1,870 4 rooms 5,404 5 rooms 10,947 6 rooms 9,336 7 rooms 8,214 8 rooms 16,496 9+ rooms
Rooms in renter-occupied apartments in Sarpy County, Nebraska
846 1 room 2,129 2 rooms 3,865 3 rooms 5,734 4 rooms 2,721 5 rooms 3,648 6 rooms 1,454 7 rooms 789 8 rooms 1,443 9+ rooms
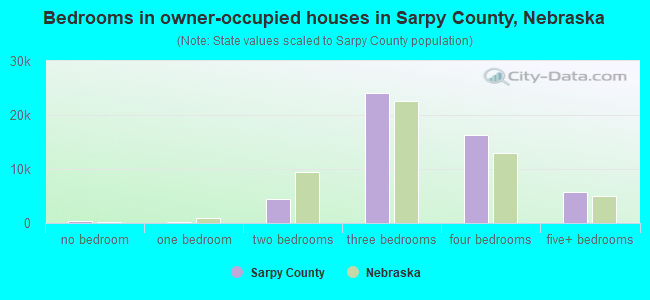
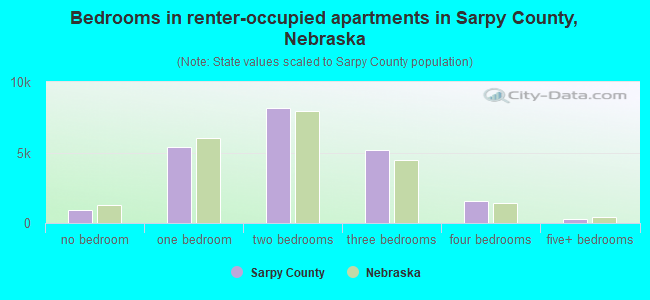
Bedrooms in houses/apartments in Sarpy County, Nebraska
Owner-occupied Renter-occupied
Bedrooms in owner-occupied houses in Sarpy County, Nebraska
217 no bedroom 188 1 bedroom 2,932 2 bedrooms 26,390 3 bedrooms 16,273 4 bedrooms 6,917 5+ bedrooms
Bedrooms in renter-occupied apartments in Sarpy County, Nebraska
922 no bedroom 6,451 1 bedroom 8,236 2 bedrooms 5,325 3 bedrooms 1,263 4 bedrooms 432 5+ bedrooms
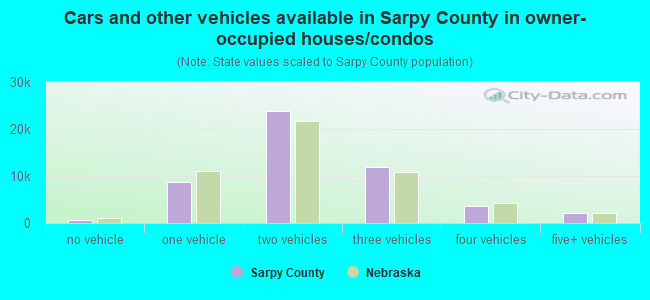
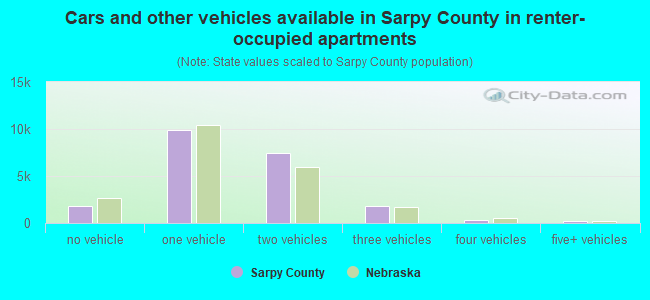
Cars and other vehicles available in Sarpy County, Nebraska in houses/condos/apartments
Owner-occupied Renter-occupied
Cars and other vehicles available in Sarpy County in owner-occupied houses/condos
375 no vehicle 8,974 1 vehicle 24,151 2 vehicles 13,906 3 vehicles 4,140 4 vehicles 1,371 5+ vehicles
Cars and other vehicles available in Sarpy County in renter-occupied apartments
1,309 no vehicle 10,561 1 vehicle 8,786 2 vehicles 1,278 3 vehicles 641 4 vehicles 54 5+ vehicles
86.6% of Sarpy County residents lived in the same house 1 years ago.
Out of people who lived in different houses, 24% lived in this county.
Out of people who lived in different counties, 52% lived in Nebraska.
Sarpy County:
86.6%State average:
87.0%
Place of birth for U.S.-born residents:
This state: 108,858Other state: 74,841Northeast: 6,537Midwest: 33,770South: 15,592West: 18,942
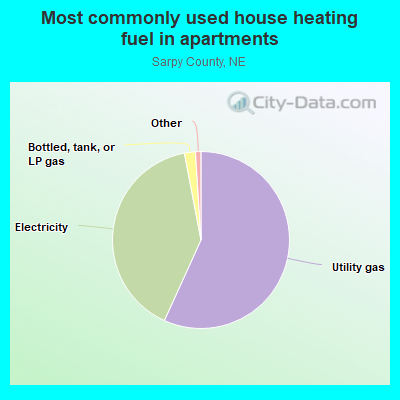
Most commonly used house heating fuel in Sarpy County
Houses and condos Apartments
79.9% Utility gas 18.1% Electricity 1.6% Bottled, tank, or LP gas 0.2% Wood 0.2% Other fuel
55.2% Utility gas 41.3% Electricity 2.3% Bottled, tank, or LP gas 0.6% No fuel used 0.3% Fuel oil, kerosene, etc. 0.1% Coal or coke
Private vs. public school enrollment:
Students in private schools in grades 1 to 8 (elementary and middle school): 3,497
Students in private schools in grades 9 to 12 (high school): 1,408
Students in private undergraduate colleges: 1,732
Sarpy County government finances - Expenditure in 2023:
Charges - Other: $30,213,000
Solid Waste Management: $6,146,000 Sewerage: $2,605,000 Parks and Recreation: $947,000 Regular Highways: $927,000Construction - Regular Highways: $3,071,000
Judicial and Legal Services: $270,000 Solid Waste Management: $224,000 Sewerage: $217,000 General - Other: $217,000 Health - Other: $86,000 Parks and Recreation: $49,000Current Operations - General - Other: $21,642,000
Police Protection: $17,727,000 Judicial and Legal Services: $14,417,000 Correctional Institutions: $11,603,000 Regular Highways: $8,735,000 Financial Administration: $7,042,000 Central Staff Services: $3,775,000 Solid Waste Management: $3,559,000 Parks and Recreation: $2,757,000 Health - Other: $2,385,000 Public Welfare - Other: $2,168,000 General Public Buildings: $1,613,000 Sewerage: $1,013,000 Natural Resources - Other: $272,000 Corrections - Other: $137,000 Public Welfare Institutions: $136,000 Housing and Community Development: $79,000Federal Intergovernmental - Other: $6,788,000
Intergovernmental to Local - Other - General - Other: $722,000
Intergovernmental to State - General - Other: $350,000
Local Intergovernmental - Other: $143,000
Miscellaneous - General Revenue - Other: $14,944,000
Interest Earnings: $9,586,000 Special Assessments: $6,150,000State Intergovernmental - Other: $22,278,000
Tax - Property: $52,153,000
Sarpy County government finances - Revenue in 2023:
Charges - Other: $30,213,000
Solid Waste Management: $6,146,000 Sewerage: $2,605,000 Parks and Recreation: $947,000 Regular Highways: $927,000Construction - Regular Highways: $3,071,000
Judicial and Legal Services: $270,000 Solid Waste Management: $224,000 Sewerage: $217,000 General - Other: $217,000 Health - Other: $86,000 Parks and Recreation: $49,000Current Operations - General - Other: $21,642,000
Police Protection: $17,727,000 Judicial and Legal Services: $14,417,000 Correctional Institutions: $11,603,000 Regular Highways: $8,735,000 Financial Administration: $7,042,000 Central Staff Services: $3,775,000 Solid Waste Management: $3,559,000 Parks and Recreation: $2,757,000 Health - Other: $2,385,000 Public Welfare - Other: $2,168,000 General Public Buildings: $1,613,000 Sewerage: $1,013,000 Natural Resources - Other: $272,000 Corrections - Other: $137,000 Public Welfare Institutions: $136,000 Housing and Community Development: $79,000Federal Intergovernmental - Other: $6,788,000
Intergovernmental to Local - Other - General - Other: $722,000
Intergovernmental to State - General - Other: $350,000
Local Intergovernmental - Other: $143,000
Miscellaneous - General Revenue - Other: $14,944,000
Interest Earnings: $9,586,000 Special Assessments: $6,150,000State Intergovernmental - Other: $22,278,000
Tax - Property: $52,153,000
Sarpy County government finances - Debt in 2023:
Charges - Other: $30,213,000
Solid Waste Management: $6,146,000 Sewerage: $2,605,000 Parks and Recreation: $947,000 Regular Highways: $927,000Construction - Regular Highways: $3,071,000
Judicial and Legal Services: $270,000 Solid Waste Management: $224,000 Sewerage: $217,000 General - Other: $217,000 Health - Other: $86,000 Parks and Recreation: $49,000Current Operations - General - Other: $21,642,000
Police Protection: $17,727,000 Judicial and Legal Services: $14,417,000 Correctional Institutions: $11,603,000 Regular Highways: $8,735,000 Financial Administration: $7,042,000 Central Staff Services: $3,775,000 Solid Waste Management: $3,559,000 Parks and Recreation: $2,757,000 Health - Other: $2,385,000 Public Welfare - Other: $2,168,000 General Public Buildings: $1,613,000 Sewerage: $1,013,000 Natural Resources - Other: $272,000 Corrections - Other: $137,000 Public Welfare Institutions: $136,000 Housing and Community Development: $79,000Federal Intergovernmental - Other: $6,788,000
Intergovernmental to Local - Other - General - Other: $722,000
Intergovernmental to State - General - Other: $350,000
Local Intergovernmental - Other: $143,000
Miscellaneous - General Revenue - Other: $14,944,000
Interest Earnings: $9,586,000 Special Assessments: $6,150,000State Intergovernmental - Other: $22,278,000
Tax - Property: $52,153,000
Sarpy County government finances - Cash and Securities in 2023:
Charges - Other: $30,213,000
Solid Waste Management: $6,146,000 Sewerage: $2,605,000 Parks and Recreation: $947,000 Regular Highways: $927,000Construction - Regular Highways: $3,071,000
Judicial and Legal Services: $270,000 Solid Waste Management: $224,000 Sewerage: $217,000 General - Other: $217,000 Health - Other: $86,000 Parks and Recreation: $49,000Current Operations - General - Other: $21,642,000
Police Protection: $17,727,000 Judicial and Legal Services: $14,417,000 Correctional Institutions: $11,603,000 Regular Highways: $8,735,000 Financial Administration: $7,042,000 Central Staff Services: $3,775,000 Solid Waste Management: $3,559,000 Parks and Recreation: $2,757,000 Health - Other: $2,385,000 Public Welfare - Other: $2,168,000 General Public Buildings: $1,613,000 Sewerage: $1,013,000 Natural Resources - Other: $272,000 Corrections - Other: $137,000 Public Welfare Institutions: $136,000 Housing and Community Development: $79,000Federal Intergovernmental - Other: $6,788,000
Intergovernmental to Local - Other - General - Other: $722,000
Intergovernmental to State - General - Other: $350,000
Local Intergovernmental - Other: $143,000
Miscellaneous - General Revenue - Other: $14,944,000
Interest Earnings: $9,586,000 Special Assessments: $6,150,000State Intergovernmental - Other: $22,278,000
Tax - Property: $52,153,000
Supplemental Security Income (SSI) in 2006:
Total number of recipients: 856Number of aged recipients: 65Number of blind and disabled recipients: 791Number of recipients under 18: 172Number of recipients between 18 and 64: 556Number of recipients older than 64: 128Number of recipients also receiving OASDI: 303Amount of payments (thousands of dollars): 383
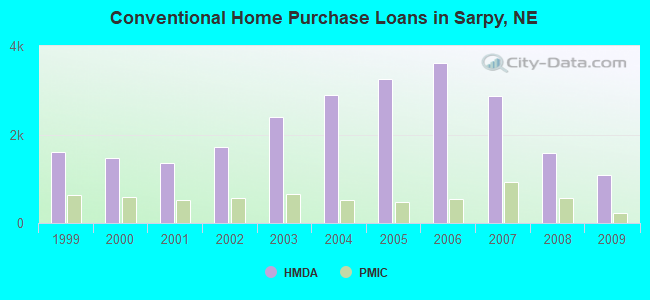
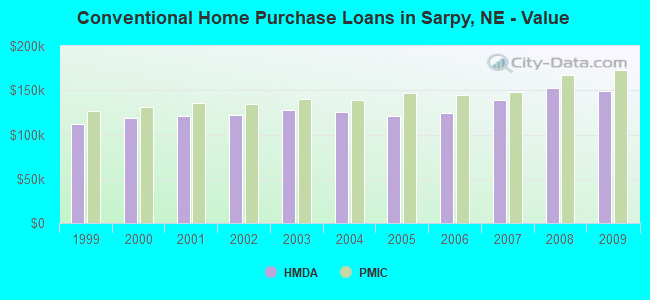
Home Mortgage Disclosure Act Aggregated Statistics For Year 2009(Based on 34 full tracts) A) FHA, FSA/RHS & VA B) Conventional C) Refinancings D) Home Improvement Loans E) Loans on Dwellings For 5+ Families F) Non-occupant Loans on G) Loans On Manufactured Number Average Value Number Average Value Number Average Value Number Average Value Number Average Value Number Average Value Number Average Value
LOANS ORIGINATED 1,917 $156,014 1,093 $148,688 5,815 $162,594 450 $40,167 12 $1,097,500 199 $105,814 8 $53,625 APPLICATIONS APPROVED, NOT ACCEPTED 44 $140,977 52 $158,019 414 $153,126 47 $25,170 1 $2,625,000 15 $114,333 1 $26,000 APPLICATIONS DENIED 106 $152,491 85 $128,871 1,070 $157,408 243 $19,473 1 $178,000 41 $97,463 9 $63,556 APPLICATIONS WITHDRAWN 91 $156,209 66 $146,606 910 $158,909 59 $75,288 0 $0 28 $117,429 0 $0 FILES CLOSED FOR INCOMPLETENESS 12 $128,250 9 $128,444 195 $164,846 19 $53,632 0 $0 5 $103,000 0 $0
Aggregated Statistics For Year 2008(Based on 34 full tracts) A) FHA, FSA/RHS & VA B) Conventional C) Refinancings D) Home Improvement Loans E) Loans on Dwellings For 5+ Families F) Non-occupant Loans on G) Loans On Manufactured Number Average Value Number Average Value Number Average Value Number Average Value Number Average Value Number Average Value Number Average Value
LOANS ORIGINATED 1,188 $159,298 1,572 $153,051 2,374 $150,794 615 $32,582 15 $1,550,800 281 $114,480 14 $26,214 APPLICATIONS APPROVED, NOT ACCEPTED 43 $145,512 113 $138,885 312 $129,436 87 $42,621 0 $0 20 $77,550 5 $34,600 APPLICATIONS DENIED 67 $144,806 123 $144,455 1,274 $145,290 422 $40,320 1 $12,000,000 62 $97,371 14 $32,000 APPLICATIONS WITHDRAWN 46 $145,761 95 $159,821 619 $156,307 68 $56,662 0 $0 32 $127,938 2 $84,500 FILES CLOSED FOR INCOMPLETENESS 11 $120,545 22 $142,136 86 $155,953 25 $52,520 0 $0 3 $35,333 0 $0
Aggregated Statistics For Year 2007(Based on 34 full tracts) A) FHA, FSA/RHS & VA B) Conventional C) Refinancings D) Home Improvement Loans E) Loans on Dwellings For 5+ Families F) Non-occupant Loans on G) Loans On Manufactured Number Average Value Number Average Value Number Average Value Number Average Value Number Average Value Number Average Value Number Average Value
LOANS ORIGINATED 667 $169,295 2,868 $138,791 2,304 $119,741 832 $35,804 11 $1,231,273 258 $103,946 15 $43,333 APPLICATIONS APPROVED, NOT ACCEPTED 22 $181,500 188 $134,686 410 $109,107 166 $39,849 1 $159,000 20 $124,450 7 $44,143 APPLICATIONS DENIED 39 $146,641 227 $118,833 1,501 $125,954 400 $33,092 1 $1,800,000 48 $109,854 44 $45,273 APPLICATIONS WITHDRAWN 23 $157,826 141 $151,482 863 $135,766 75 $68,427 1 $250,000 29 $141,379 1 $70,000 FILES CLOSED FOR INCOMPLETENESS 1 $138,000 39 $112,051 184 $153,630 11 $43,818 0 $0 3 $99,000 0 $0
Aggregated Statistics For Year 2006(Based on 34 full tracts) A) FHA, FSA/RHS & VA B) Conventional C) Refinancings D) Home Improvement Loans E) Loans on Dwellings For 5+ Families F) Non-occupant Loans on G) Loans On Manufactured Number Average Value Number Average Value Number Average Value Number Average Value Number Average Value Number Average Value Number Average Value
LOANS ORIGINATED 874 $163,386 3,613 $124,777 2,533 $103,148 810 $29,428 16 $947,312 382 $95,788 21 $49,095 APPLICATIONS APPROVED, NOT ACCEPTED 21 $155,714 247 $115,073 423 $107,778 150 $32,433 0 $0 26 $91,769 8 $57,750 APPLICATIONS DENIED 29 $142,724 334 $114,234 1,498 $117,743 438 $31,226 0 $0 76 $93,079 24 $52,167 APPLICATIONS WITHDRAWN 32 $150,656 226 $131,628 1,027 $126,965 75 $43,347 0 $0 38 $118,553 3 $88,000 FILES CLOSED FOR INCOMPLETENESS 1 $148,000 69 $108,957 196 $133,730 13 $34,000 0 $0 5 $109,000 0 $0
Aggregated Statistics For Year 2005(Based on 34 full tracts) A) FHA, FSA/RHS & VA B) Conventional C) Refinancings D) Home Improvement Loans E) Loans on Dwellings For 5+ Families F) Non-occupant Loans on G) Loans On Manufactured Number Average Value Number Average Value Number Average Value Number Average Value Number Average Value Number Average Value Number Average Value
LOANS ORIGINATED 746 $155,227 3,253 $120,969 3,005 $113,005 769 $31,074 11 $2,755,636 301 $94,767 11 $26,909 APPLICATIONS APPROVED, NOT ACCEPTED 24 $125,333 229 $116,341 431 $104,787 95 $22,979 0 $0 22 $85,591 7 $53,429 APPLICATIONS DENIED 31 $136,742 275 $98,927 1,595 $118,920 432 $36,840 1 $1,240,000 62 $89,000 29 $54,931 APPLICATIONS WITHDRAWN 32 $164,906 285 $123,526 1,065 $123,969 139 $70,468 2 $1,200,000 51 $119,471 7 $159,286 FILES CLOSED FOR INCOMPLETENESS 1 $240,000 63 $124,714 273 $129,062 21 $79,714 0 $0 6 $95,667 1 $144,000
Aggregated Statistics For Year 2004(Based on 34 full tracts) A) FHA, FSA/RHS & VA B) Conventional C) Refinancings D) Home Improvement Loans E) Loans on Dwellings For 5+ Families F) Non-occupant Loans on G) Loans On Manufactured Number Average Value Number Average Value Number Average Value Number Average Value Number Average Value Number Average Value Number Average Value
LOANS ORIGINATED 775 $146,566 2,903 $125,935 3,440 $112,804 627 $29,405 10 $1,057,500 317 $94,864 19 $35,474 APPLICATIONS APPROVED, NOT ACCEPTED 26 $141,808 213 $117,873 515 $111,810 105 $32,152 0 $0 30 $96,700 11 $58,818 APPLICATIONS DENIED 46 $142,043 283 $90,339 1,629 $112,981 445 $29,562 1 $454,000 69 $87,449 37 $36,351 APPLICATIONS WITHDRAWN 56 $138,339 215 $137,953 1,071 $122,289 116 $45,121 0 $0 44 $102,955 3 $108,000 FILES CLOSED FOR INCOMPLETENESS 7 $125,429 56 $123,125 465 $134,516 39 $39,615 0 $0 12 $72,417 1 $62,000
Aggregated Statistics For Year 2003(Based on 34 full tracts) A) FHA, FSA/RHS & VA B) Conventional C) Refinancings D) Home Improvement Loans E) Loans on Dwellings For 5+ Families F) Non-occupant Loans on Number Average Value Number Average Value Number Average Value Number Average Value Number Average Value Number Average Value
LOANS ORIGINATED 1,011 $137,696 2,394 $127,420 9,493 $115,859 612 $21,735 10 $685,500 462 $90,030 APPLICATIONS APPROVED, NOT ACCEPTED 22 $132,636 196 $109,913 690 $109,971 107 $23,888 0 $0 39 $89,385 APPLICATIONS DENIED 35 $123,171 223 $96,722 2,059 $105,586 312 $20,875 0 $0 60 $78,883 APPLICATIONS WITHDRAWN 64 $141,562 182 $136,879 1,417 $109,766 49 $30,878 0 $0 46 $101,130 FILES CLOSED FOR INCOMPLETENESS 8 $130,875 45 $113,889 268 $122,403 10 $47,700 0 $0 11 $103,364
Aggregated Statistics For Year 2002(Based on 23 full tracts) A) FHA, FSA/RHS & VA B) Conventional C) Refinancings D) Home Improvement Loans E) Loans on Dwellings For 5+ Families F) Non-occupant Loans on Number Average Value Number Average Value Number Average Value Number Average Value Number Average Value Number Average Value
LOANS ORIGINATED 894 $119,499 1,713 $121,889 5,986 $112,394 817 $20,640 10 $2,510,000 368 $81,215 APPLICATIONS APPROVED, NOT ACCEPTED 21 $119,762 140 $109,250 599 $100,209 122 $26,648 0 $0 25 $80,320 APPLICATIONS DENIED 37 $114,946 159 $83,660 1,239 $90,818 336 $15,688 0 $0 50 $74,360 APPLICATIONS WITHDRAWN 59 $126,017 110 $116,891 1,314 $108,240 75 $19,160 0 $0 24 $80,583 FILES CLOSED FOR INCOMPLETENESS 8 $107,375 32 $104,906 345 $104,699 9 $21,222 0 $0 8 $75,625
Aggregated Statistics For Year 2001(Based on 23 full tracts) A) FHA, FSA/RHS & VA B) Conventional C) Refinancings D) Home Improvement Loans E) Loans on Dwellings For 5+ Families F) Non-occupant Loans on Number Average Value Number Average Value Number Average Value Number Average Value Number Average Value Number Average Value
LOANS ORIGINATED 937 $116,835 1,354 $120,681 4,435 $103,768 798 $16,048 14 $1,960,643 226 $76,239 APPLICATIONS APPROVED, NOT ACCEPTED 14 $117,786 128 $94,703 453 $89,435 132 $16,841 1 $169,000 13 $57,462 APPLICATIONS DENIED 34 $108,882 235 $64,872 1,111 $79,412 397 $12,975 3 $899,667 45 $73,200 APPLICATIONS WITHDRAWN 31 $127,452 115 $137,174 935 $96,913 115 $19,922 1 $75,000 19 $93,000 FILES CLOSED FOR INCOMPLETENESS 4 $113,750 21 $108,952 274 $98,679 31 $20,742 0 $0 6 $78,333
Aggregated Statistics For Year 2000(Based on 23 full tracts) A) FHA, FSA/RHS & VA B) Conventional C) Refinancings D) Home Improvement Loans E) Loans on Dwellings For 5+ Families F) Non-occupant Loans on Number Average Value Number Average Value Number Average Value Number Average Value Number Average Value Number Average Value
LOANS ORIGINATED 1,127 $111,209 1,468 $118,915 1,360 $70,249 833 $14,607 9 $2,818,000 143 $80,825 APPLICATIONS APPROVED, NOT ACCEPTED 16 $110,688 136 $89,000 266 $68,823 186 $18,194 0 $0 10 $72,500 APPLICATIONS DENIED 33 $110,970 258 $69,395 784 $62,255 384 $17,151 0 $0 19 $68,211 APPLICATIONS WITHDRAWN 41 $110,171 109 $111,881 319 $70,166 42 $24,071 0 $0 9 $88,667 FILES CLOSED FOR INCOMPLETENESS 2 $78,500 18 $136,778 192 $86,797 7 $24,714 0 $0 1 $15,000
Aggregated Statistics For Year 1999(Based on 23 full tracts) A) FHA, FSA/RHS & VA B) Conventional C) Refinancings D) Home Improvement Loans E) Loans on Dwellings For 5+ Families F) Non-occupant Loans on Number Average Value Number Average Value Number Average Value Number Average Value Number Average Value Number Average Value
LOANS ORIGINATED 1,177 $106,984 1,600 $111,652 2,086 $74,513 855 $14,030 9 $2,256,778 168 $71,774 APPLICATIONS APPROVED, NOT ACCEPTED 9 $104,889 105 $91,781 300 $66,710 143 $13,287 1 $2,000,000 14 $55,571 APPLICATIONS DENIED 49 $94,061 366 $56,959 647 $64,864 350 $15,817 1 $541,000 49 $45,571 APPLICATIONS WITHDRAWN 49 $109,469 102 $96,490 364 $76,893 57 $38,982 0 $0 12 $83,833 FILES CLOSED FOR INCOMPLETENESS 3 $97,333 33 $90,909 164 $75,598 7 $23,571 0 $0 3 $53,333
Private Mortgage Insurance Companies Aggregated Statistics For Year 2009(Based on 32 full tracts) A) Conventional B) Refinancings C) Non-occupant Loans on Number Average Value Number Average Value Number Average Value
LOANS ORIGINATED 233 $172,618 271 $182,472 3 $134,000 APPLICATIONS APPROVED, NOT ACCEPTED 34 $209,000 72 $184,611 1 $169,000 APPLICATIONS DENIED 13 $201,231 35 $189,686 0 $0 APPLICATIONS WITHDRAWN 5 $209,400 9 $169,778 0 $0 FILES CLOSED FOR INCOMPLETENESS 4 $256,250 1 $165,000 0 $0
Aggregated Statistics For Year 2008(Based on 33 full tracts) A) Conventional B) Refinancings C) Non-occupant Loans on Number Average Value Number Average Value Number Average Value
LOANS ORIGINATED 560 $167,632 286 $184,759 34 $138,824 APPLICATIONS APPROVED, NOT ACCEPTED 119 $165,235 121 $172,628 5 $136,200 APPLICATIONS DENIED 33 $162,545 11 $199,636 10 $137,400 APPLICATIONS WITHDRAWN 11 $182,636 8 $153,375 1 $101,000 FILES CLOSED FOR INCOMPLETENESS 11 $121,091 5 $179,000 6 $113,000
Aggregated Statistics For Year 2007(Based on 33 full tracts) A) Conventional B) Refinancings C) Non-occupant Loans on D) Loans On Manufactured Number Average Value Number Average Value Number Average Value Number Average Value
LOANS ORIGINATED 929 $147,836 260 $154,700 27 $116,519 0 $0 APPLICATIONS APPROVED, NOT ACCEPTED 89 $163,416 56 $183,268 4 $153,500 0 $0 APPLICATIONS DENIED 10 $147,100 5 $308,800 1 $306,000 1 $57,000 APPLICATIONS WITHDRAWN 22 $143,773 23 $165,043 2 $269,000 0 $0 FILES CLOSED FOR INCOMPLETENESS 3 $144,333 1 $135,000 0 $0 0 $0
Aggregated Statistics For Year 2006(Based on 33 full tracts) A) Conventional B) Refinancings C) Non-occupant Loans on Number Average Value Number Average Value Number Average Value
LOANS ORIGINATED 547 $144,653 162 $154,877 20 $110,550 APPLICATIONS APPROVED, NOT ACCEPTED 63 $158,349 40 $157,425 5 $175,800 APPLICATIONS DENIED 4 $244,000 6 $264,667 0 $0 APPLICATIONS WITHDRAWN 31 $148,581 5 $161,800 3 $129,667 FILES CLOSED FOR INCOMPLETENESS 1 $105,000 1 $108,000 0 $0
Aggregated Statistics For Year 2005(Based on 32 full tracts) A) Conventional B) Refinancings C) Non-occupant Loans on Number Average Value Number Average Value Number Average Value
LOANS ORIGINATED 474 $146,888 267 $138,472 38 $112,263 APPLICATIONS APPROVED, NOT ACCEPTED 50 $183,600 49 $138,347 5 $102,600 APPLICATIONS DENIED 4 $111,500 2 $283,000 2 $103,500 APPLICATIONS WITHDRAWN 19 $178,526 17 $128,765 2 $169,500 FILES CLOSED FOR INCOMPLETENESS 4 $173,000 2 $124,500 1 $83,000
Aggregated Statistics For Year 2004(Based on 33 full tracts) A) Conventional B) Refinancings C) Non-occupant Loans on D) Loans On Manufactured Number Average Value Number Average Value Number Average Value Number Average Value
LOANS ORIGINATED 517 $139,348 333 $133,772 36 $105,250 4 $71,750 APPLICATIONS APPROVED, NOT ACCEPTED 68 $144,368 93 $142,118 7 $106,429 0 $0 APPLICATIONS DENIED 7 $145,857 1 $162,000 3 $107,333 0 $0 APPLICATIONS WITHDRAWN 20 $165,250 33 $145,636 6 $143,833 0 $0 FILES CLOSED FOR INCOMPLETENESS 0 $0 2 $120,000 0 $0 0 $0
Aggregated Statistics For Year 2003(Based on 33 full tracts) A) Conventional B) Refinancings C) Non-occupant Loans on Number Average Value Number Average Value Number Average Value
LOANS ORIGINATED 662 $140,669 1,214 $130,966 64 $99,219 APPLICATIONS APPROVED, NOT ACCEPTED 54 $166,278 175 $128,537 7 $96,143 APPLICATIONS DENIED 7 $133,429 5 $170,600 4 $99,750 APPLICATIONS WITHDRAWN 18 $137,278 71 $136,000 4 $93,000 FILES CLOSED FOR INCOMPLETENESS 0 $0 2 $223,500 0 $0
Aggregated Statistics For Year 2002(Based on 23 full tracts) A) Conventional B) Refinancings C) Non-occupant Loans on Number Average Value Number Average Value Number Average Value
LOANS ORIGINATED 567 $134,638 819 $130,353 34 $96,176 APPLICATIONS APPROVED, NOT ACCEPTED 47 $157,191 104 $127,654 4 $86,250 APPLICATIONS DENIED 5 $112,400 4 $141,750 0 $0 APPLICATIONS WITHDRAWN 21 $141,381 40 $126,900 6 $118,167 FILES CLOSED FOR INCOMPLETENESS 1 $122,000 2 $153,000 0 $0
Aggregated Statistics For Year 2001(Based on 21 full tracts) A) Conventional B) Refinancings C) Non-occupant Loans on Number Average Value Number Average Value Number Average Value
LOANS ORIGINATED 516 $136,047 584 $130,455 26 $84,846 APPLICATIONS APPROVED, NOT ACCEPTED 64 $133,109 64 $135,000 14 $105,857 APPLICATIONS DENIED 5 $141,200 8 $148,375 4 $158,500 APPLICATIONS WITHDRAWN 7 $135,143 19 $117,737 0 $0 FILES CLOSED FOR INCOMPLETENESS 1 $67,000 1 $123,000 0 $0
Aggregated Statistics For Year 2000(Based on 22 full tracts) A) Conventional B) Refinancings C) Non-occupant Loans on Number Average Value Number Average Value Number Average Value
LOANS ORIGINATED 578 $130,720 101 $110,505 19 $87,789 APPLICATIONS APPROVED, NOT ACCEPTED 30 $144,833 17 $129,000 1 $86,000 APPLICATIONS DENIED 8 $162,875 11 $124,182 6 $137,000 APPLICATIONS WITHDRAWN 28 $108,750 4 $106,000 0 $0 FILES CLOSED FOR INCOMPLETENESS 4 $116,500 1 $98,000 0 $0
Aggregated Statistics For Year 1999(Based on 23 full tracts) A) Conventional B) Refinancings C) Non-occupant Loans on Number Average Value Number Average Value Number Average Value
LOANS ORIGINATED 640 $126,181 182 $102,363 18 $65,278 APPLICATIONS APPROVED, NOT ACCEPTED 29 $134,552 24 $105,000 1 $54,000 APPLICATIONS DENIED 9 $96,889 6 $89,833 2 $52,000 APPLICATIONS WITHDRAWN 11 $117,818 1 $164,000 1 $84,000 FILES CLOSED FOR INCOMPLETENESS 0 $0 2 $93,000 0 $0
Most common first names in Sarpy County, NE among deceased individuals Name Count Lived (average)
John 307 72.6 years Mary 280 78.3 years William 244 74.0 years Robert 238 70.5 years James 214 69.6 years Helen 167 81.5 years Charles 166 73.6 years Margaret 150 79.2 years George 137 75.4 years Joseph 132 75.3 years
Most common last names in Sarpy County, NE among deceased individuals Last name Count Lived (average)
Smith 99 75.6 years Johnson 79 74.4 years Miller 57 74.7 years Hansen 53 77.2 years Williams 47 74.5 years Jones 44 72.0 years Anderson 38 73.7 years Brown 38 73.3 years Davis 38 66.3 years Clark 35 73.0 years
Businesses in Sarpy County, NE
Name Count Name Count
24 Hour Fitness 1 Long John Silver's 2 ALDI 1 Lowe's 1 AT&T 1 Marriott 1 Ace Hardware 2 MasterBrand Cabinets 6 Advance Auto Parts 2 Maurices 1 Aeropostale 1 McDonald's 7 American Eagle Outfitters 1 Menards 1 Ann Taylor 1 Microtel 1 Applebee's 2 Motel 6 1 Arby's 3 Motherhood Maternity 3 AutoZone 2 New Balance 2 Avenue 1 Nike 5 Bath & Body Works 1 Nissan 1 Bed Bath & Beyond 1 Office Depot 1 Best Western 1 OfficeMax 1 Blockbuster 2 Old Navy 1 Buffalo Wild Wings 2 Outback 1 Burger King 6 Outback Steakhouse 1 CVS 1 Panda Express 1 Chevrolet 1 Panera Bread 2 Chico's 1 Papa John's Pizza 2 Chipotle 1 Payless 2 Coldwater Creek 1 Penske 3 Comfort Inn 1 PetSmart 1 Cracker Barrel 1 Pizza Hut 4 Cricket Wireless 5 Popeyes 2 Curves 2 Qdoba Mexican Grill 1 DHL 1 Quality 1 Dairy Queen 2 Quiznos 1 Dennys 1 RadioShack 2 Domino's Pizza 1 Red Robin 1 DressBarn 2 Rodeway Inn 1 Dressbarn 1 Ruby Tuesday 1 Famous Footwear 1 Rue21 1 FedEx 15 SONIC Drive-In 3 Finish Line 1 Sears 1 Firestone Complete Auto Care 2 Sephora 1 Ford 1 Sprint Nextel 2 GNC 4 Starbucks 6 GameStop 3 Subaru 1 Goodwill 2 Subway 10 H&R Block 5 Super 8 1 Hardee's 1 T.J.Maxx 1 Hilton 2 Taco Bell 4 Hobby Lobby 1 Target 2 Holiday Inn 3 Toyota 2 Home Depot 1 Toys"R"Us 1 Honda 1 U-Haul 10 IHOP 2 U.S. Cellular 2 JCPenney 1 UPS 21 JoS. A. Bank 1 Vans 1 Jones New York 1 Verizon Wireless 4 Justice 1 Victoria's Secret 1 KFC 2 Village Inn 3 Kohl's 1 Volkswagen 1 Kroger 8 Walgreens 5 Lane Bryant 2 Walmart 3 LensCrafters 1 Wendy's 2 Little Caesars Pizza 1 YMCA 2
Sarpy County on our top lists :
#12 on the list of "Top 101 counties with the largest number of children under 18 without health insurance coverage in 2000 (pop. 50,000+)"
#31 on the list of "Top 101 counties with the lowest number of deaths per 1000 residents 2007-2013 (pop. 50,000+)"
#38 on the list of "Top 101 counties with the best general health status score of residents (1-5), 3 years of data"
#42 on the list of "Top 101 counties with the highest number of births per 1000 residents 2007-2013"
#42 on the list of "Top 101 counties with the highest number of births per 1000 residents 2007-2013 (pop 50,000+)"
#44 on the list of "Top 101 counties with the highest percentage of residents that visited a dentist within the past year"
#46 on the list of "Top 101 counties with the highest percentage of residents that keep firearms around their homes"
#49 on the list of "Top 101 counties with the highest average weight of females"
#49 on the list of "Top 101 counties with the highest percentage of residents relocating to foreign countries in 2011 (pop. 50,000+)"
#63 on the list of "Top 101 counties with the largest number of children under 18 without health insurance coverage in 2000"
#65 on the list of "Top 101 counties with the highest percentage of residents relocating to other counties in 2011 (pop. 50,000+)"
#66 on the list of "Top 101 counties with the highest percentage of residents that exercised in the past month"
#66 on the list of "Top 101 counties with the highest percentage of residents relocating from other counties between 2010 and 2011 (pop. 50,000+)"
#67 on the list of "Top 101 counties with the highest percentage of residents relocating from foreign countries between 2010 and 2011 (pop. 50,000+)"
#71 on the list of "Top 101 counties with the largest increase in the number of deaths per 1000 residents 2000-2006 to 2007-2013 (pop. 50,000+)"
#72 on the list of "Top 101 counties with the highest percentage of residents relocating to foreign countries in 2011"
#79 on the list of "Top 101 counties with the lowest number of deaths per 1000 residents 2007-2013"
#93 on the list of "Top 101 counties with the highest percentage of residents relocating from foreign countries between 2010 and 2011"
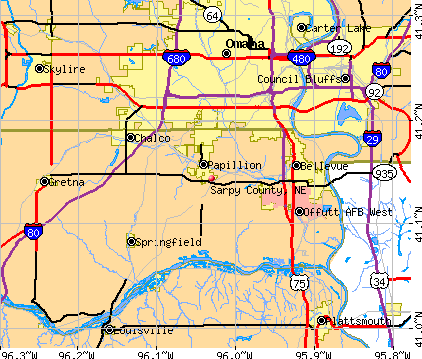


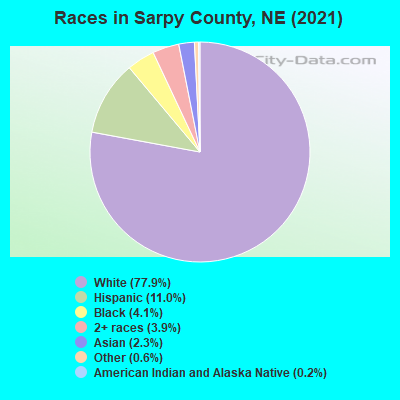


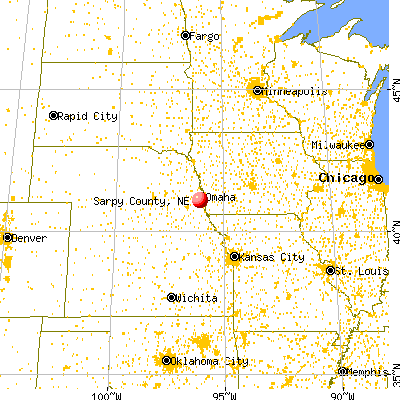

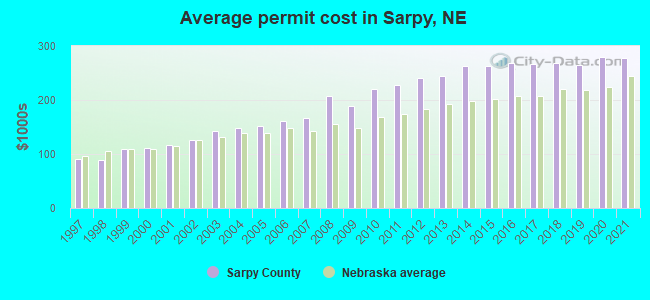
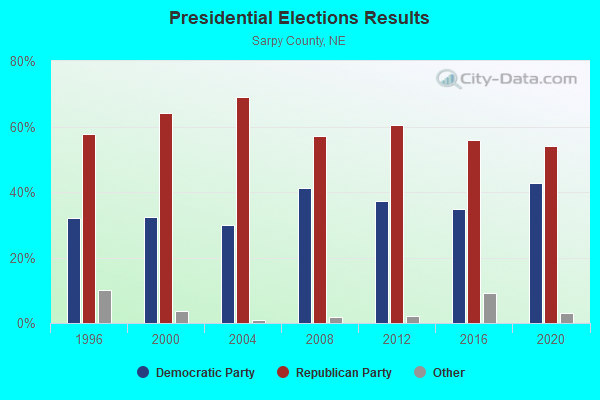
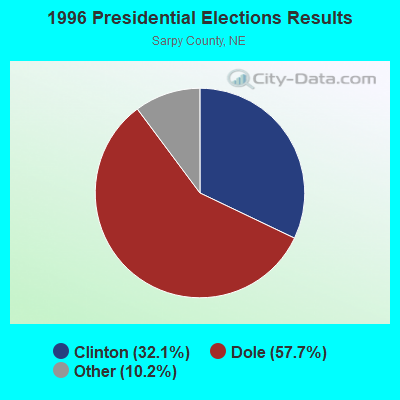
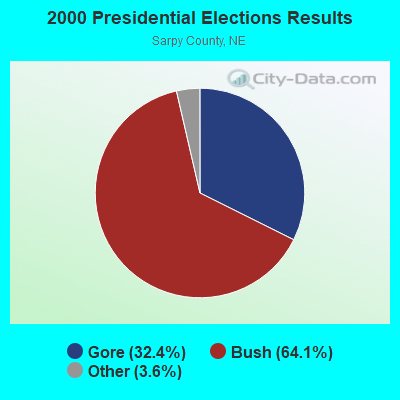
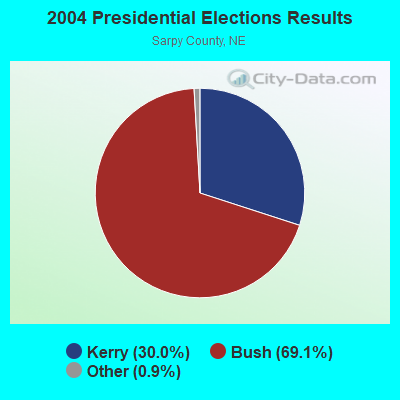
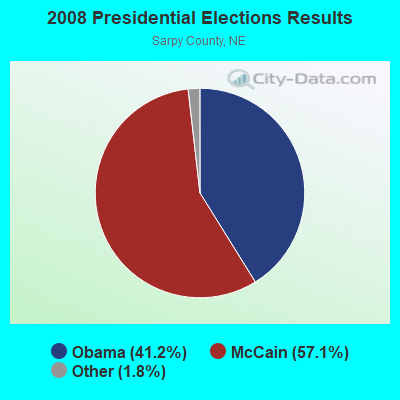
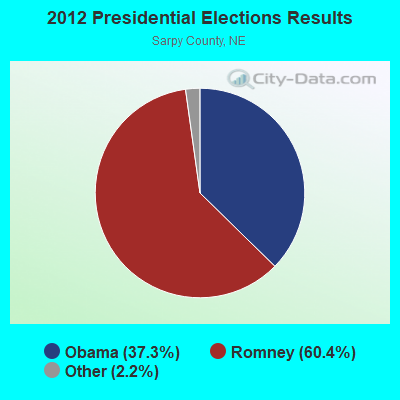
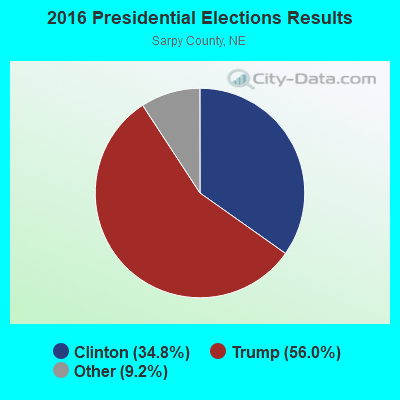
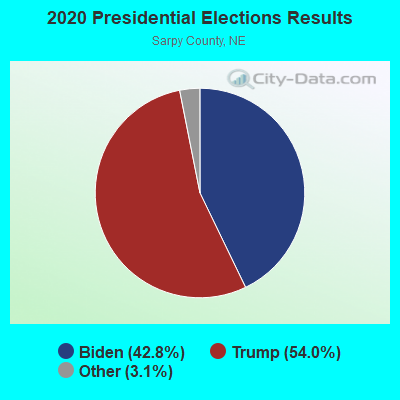

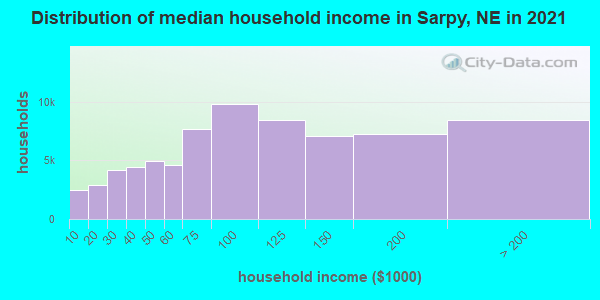

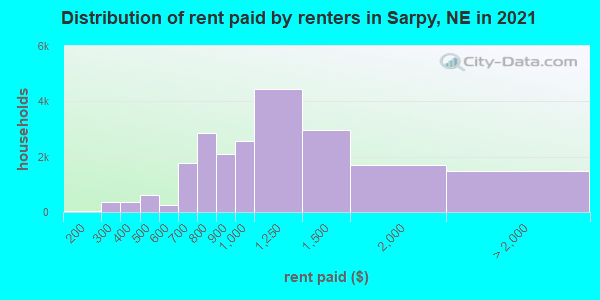
 , Douglas County
  , Mills County, Iowa
  , Pottawattamie County, Iowa
  , Saunders County
  .
.