
Franklin County, Washington
Franklin County, Washington | |
|---|---|
 The Franklin County Courthouse in Pasco | |
 Location within the U.S. state of Washington | |
| Coordinates: 46°32′15″N 118°54′14″W / 46.537502°N 118.903891°W | |
| Country | |
| State | |
| Founded | November 28, 1883 |
| Named after | Benjamin Franklin |
| Seat | Pasco |
| Largest city | Pasco |
| Government | |
| • Sheriff | Marcus Conner |
| Area | |
• Total | 1,264.959 sq mi (3,276.23 km2) |
| • Land | 1,241.596 sq mi (3,215.72 km2) |
| • Water | 23.363 sq mi (60.51 km2) 1.85% |
| Population (2020) | |
• Total | 96,749 |
• Estimate (2024) | 101,238 |
| • Density | 77.923/sq mi (30.086/km2) |
| Time zone | UTC−8 (Pacific) |
| • Summer (DST) | UTC−7 (PDT) |
| Area code | 509 |
| Congressional districts | 4th, 5th |
| Website | franklincountywa.gov |
Franklin County is a county located in the U.S. state of Washington. As of the 2020 census, its population was 96,749,[1] and was estimated to be 101,238 in 2024.[2] The county seat and largest city is Pasco.[3]
The county was formed out of Whitman County on November 28, 1883,[4][5] and is named for Benjamin Franklin.[6]
Franklin County is included in the Tri-Cities metropolitan area. Together, Kennewick, Richland and Pasco comprise Washington's Tri-Cities.
Geography
[edit]According to the United States Census Bureau, the county has a total area of 1,264.959 square miles (3,276.23 km2), of which 1,241.596 square miles (3,215.72 km2) is land and 23.363 square miles (60.51 km2) (1.85%) is water.[7] It is the 27th largest county in Washington by total area.[8]
Geographic features
[edit]Major highways
[edit]Adjacent counties
[edit]- Adams County - north
- Whitman County - east
- Walla Walla County - southeast
- Columbia County - southeast
- Benton County - southwest
- Grant County - northwest
National protected areas
[edit]Demographics
[edit]| Census | Pop. | Note | %± |
|---|---|---|---|
| 1890 | 696 | — | |
| 1900 | 486 | −30.2% | |
| 1910 | 5,153 | 960.3% | |
| 1920 | 5,877 | 14.1% | |
| 1930 | 6,137 | 4.4% | |
| 1940 | 6,307 | 2.8% | |
| 1950 | 13,563 | 115.0% | |
| 1960 | 23,342 | 72.1% | |
| 1970 | 25,816 | 10.6% | |
| 1980 | 35,025 | 35.7% | |
| 1990 | 37,473 | 7.0% | |
| 2000 | 49,347 | 31.7% | |
| 2010 | 78,163 | 58.4% | |
| 2020 | 96,749 | 23.8% | |
| 2024 (est.) | 101,238 | [9] | 4.6% |
| U.S. Decennial Census[10] 1790–1960[11] 1900–1990[12] 1990–2000[13] 2010–2020 | |||
2024–2025 estimates
[edit]As of the second quarter of 2025, the median home value in Franklin County was $416,327.[14]
As of the 2024 American Community Survey, there are 31,564 estimated households in Franklin County with an average of 3.09 persons per household. The county has a median household income of $81,604. Approximately 17.8% of the county's population lives at or below the poverty line. Franklin County has an estimated 58.1% employment rate, with 21.3% of the population holding a bachelor's degree or higher and 80.0% holding a high school diploma.[2] There were 32,687 housing units at an average density of 26.33 per square mile (10.2/km2).[2]
The median age in the county was 32.5 years.[2]
2020 census
[edit]| Race / ethnicity (NH = non-Hispanic) | Pop. 1980[15] | Pop. 1990[16] | Pop. 2000[17] | Pop. 2010[18] | Pop. 2020[19] |
|---|---|---|---|---|---|
| White alone (NH) | 27,502 (78.52%) |
23,784 (63.47%) |
23,470 (47.56%) |
33,804 (43.25%) |
37,225 (38.48%) |
| Black or African American alone (NH) | 1,441 (4.11%) |
1,251 (3.34%) |
1,120 (2.27%) |
1,339 (1.71%) |
1,603 (1.66%) |
| Native American or Alaska Native alone (NH) | 234 (0.67%) |
217 (0.58%) |
235 (0.48%) |
357 (0.46%) |
437 (0.45%) |
| Asian alone (NH) | 330 (0.94%) |
805 (2.15%) |
767 (1.55%) |
1,384 (1.77%) |
1,796 (1.86%) |
| Pacific Islander alone (NH) | — | — | 32 (0.06%) |
92 (0.12%) |
195 (0.20%) |
| Other race alone (NH) | 106 (0.30%) |
100 (0.27%) |
39 (0.08%) |
96 (0.12%) |
338 (0.35%) |
| Mixed race or multiracial (NH) | — | — | 652 (1.32%) |
1,087 (1.39%) |
2,710 (2.80%) |
| Hispanic or Latino (any race) | 5,412 (15.45%) |
11,316 (30.20%) |
23,032 (46.67%) |
40,004 (51.18%) |
52,445 (54.21%) |
| Total | 35,025 (100.00%) |
37,473 (100.00%) |
49,347 (100.00%) |
78,163 (100.00%) |
96,749 (100.00%) |
As of the 2020 census, the county had a population of 96,749.[20] Of the residents, 31.5% were under the age of 18 and 9.9% were 65 years of age or older; the median age was 30.9 years. For every 100 females there were 106.9 males, and for every 100 females age 18 and over there were 109.0 males. 88.6% of residents lived in urban areas and 11.4% lived in rural areas.[21]
The population density was 77.92 inhabitants per square mile (30.1/km2) and there were 29,740 housing units at an average density of 23.95 per square mile (9.2/km2). Of those units, 3.3% were vacant; among occupied housing units, 68.3% were owner-occupied and 31.7% were renter-occupied. The homeowner vacancy rate was 0.5% and the rental vacancy rate was 3.6%.[22]
The racial makeup of the county was 47.4% White, 1.9% Black or African American, 1.5% American Indian and Alaska Native, 2.0% Asian, 30.4% from some other race, and 16.7% from two or more races. Hispanic or Latino residents of any race comprised 54.2% of the population.[20]
There were 28,748 households in the county, of which 47.5% had children under the age of 18 living with them and 20.7% had a female householder with no spouse or partner present. About 16.5% of all households were made up of individuals and 6.4% had someone living alone who was 65 years of age or older.[22]
2010 census
[edit]As of the 2010 census, there were 78,163 people, 23,245 households, and 18,163 families residing in the county. The population density was 62.95 inhabitants per square mile (24.3/km2). There were 24,423 housing units at an average density of 19.67 per square mile (7.6/km2). The racial makeup of the county was 60.48% White, 1.88% African American, 0.68% Native American, 1.83% Asian, 0.14% Pacific Islander, 31.83% from some other races and 3.16% from two or more races. Hispanic or Latino people of any race were 51.18% of the population.
In terms of ancestry, 13.1% were German, 6.8% were English, 6.5% were Irish, and 3.3% were American.
There were 23,245 households, 49.9% had children under the age of 18 living with them, 57.9% were married couples living together, 13.4% had a female householder with no husband present, 21.9% were non-families, and 16.4% of all households were made up of individuals. The average household size was 3.28 and the average family size was 3.68. The median age was 28.4 years.
The median income for a household in the county was $47,749 and the median income for a family was $52,218. Males had a median income of $40,604 versus $29,517 for females. The per capita income for the county was $18,660. About 16.5% of families and 19.9% of the population were below the poverty line, including 25.6% of those under age 18 and 13.7% of those age 65 or over.
Communities
[edit]Cities
[edit]Census-designated places
[edit]Unincorporated communities
[edit]Former communities
[edit]Government
[edit]Franklin County has a Board of County Commissioners which is the governmental authority of the county. The board consists of three commissioners; they are elected by the voters and serve four-year terms.[23] Other elected county officials include Assessor, Auditor, Clerk, Coroner, Prosecuting Attorney, Sheriff, and Treasurer.[24]
Politics
[edit]| Year | Republican | Democratic | Third party(ies) | |||
|---|---|---|---|---|---|---|
| No. | % | No. | % | No. | % | |
| 1892 | 28 | 23.53% | 54 | 45.38% | 37 | 31.09% |
| 1896 | 38 | 24.84% | 113 | 73.86% | 2 | 1.31% |
| 1900 | 52 | 37.41% | 81 | 58.27% | 6 | 4.32% |
| 1904 | 572 | 69.25% | 223 | 27.00% | 31 | 3.75% |
| 1908 | 643 | 52.97% | 485 | 39.95% | 86 | 7.08% |
| 1912 | 293 | 16.41% | 612 | 34.29% | 880 | 49.30% |
| 1916 | 671 | 35.02% | 1,110 | 57.93% | 135 | 7.05% |
| 1920 | 839 | 44.46% | 571 | 30.26% | 477 | 25.28% |
| 1924 | 709 | 31.15% | 237 | 10.41% | 1,330 | 58.44% |
| 1928 | 1,339 | 61.96% | 799 | 36.97% | 23 | 1.06% |
| 1932 | 838 | 33.89% | 1,540 | 62.27% | 95 | 3.84% |
| 1936 | 622 | 23.98% | 1,784 | 68.77% | 188 | 7.25% |
| 1940 | 1,084 | 36.34% | 1,868 | 62.62% | 31 | 1.04% |
| 1944 | 1,381 | 40.97% | 1,974 | 58.56% | 16 | 0.47% |
| 1948 | 1,541 | 37.31% | 2,525 | 61.14% | 64 | 1.55% |
| 1952 | 3,291 | 53.89% | 2,798 | 45.82% | 18 | 0.29% |
| 1956 | 3,763 | 46.51% | 4,322 | 53.42% | 5 | 0.06% |
| 1960 | 4,201 | 44.65% | 5,156 | 54.80% | 52 | 0.55% |
| 1964 | 3,615 | 35.94% | 6,375 | 63.38% | 68 | 0.68% |
| 1968 | 4,234 | 44.22% | 4,038 | 42.17% | 1,303 | 13.61% |
| 1972 | 5,972 | 56.75% | 3,867 | 36.75% | 684 | 6.50% |
| 1976 | 5,671 | 54.51% | 4,369 | 42.00% | 363 | 3.49% |
| 1980 | 7,327 | 61.26% | 3,719 | 31.09% | 915 | 7.65% |
| 1984 | 7,724 | 62.96% | 4,328 | 35.28% | 216 | 1.76% |
| 1988 | 6,488 | 56.65% | 4,772 | 41.67% | 192 | 1.68% |
| 1992 | 4,486 | 41.02% | 3,743 | 34.22% | 2,708 | 24.76% |
| 1996 | 5,946 | 49.16% | 4,961 | 41.01% | 1,189 | 9.83% |
| 2000 | 8,594 | 63.13% | 4,653 | 34.18% | 367 | 2.70% |
| 2004 | 10,757 | 66.57% | 5,188 | 32.11% | 214 | 1.32% |
| 2008 | 12,037 | 61.11% | 7,361 | 37.37% | 298 | 1.51% |
| 2012 | 13,748 | 60.72% | 8,398 | 37.09% | 497 | 2.19% |
| 2016 | 13,206 | 53.65% | 8,886 | 36.10% | 2,522 | 10.25% |
| 2020 | 18,039 | 55.67% | 13,340 | 41.17% | 1,025 | 3.16% |
| 2024 | 19,086 | 59.84% | 11,884 | 37.26% | 927 | 2.91% |
Franklin is a strongly Republican county in Presidential elections. No Democratic presidential candidate has carried Franklin County since Lyndon B. Johnson’s 1964 landslide, and the last Democratic gubernatorial candidate it backed was Dixy Lee Ray in 1976.[28]
See also
[edit]References
[edit]- ^ "Explore Census Data". United States Census Bureau. Retrieved November 21, 2025.
- ^ a b c d "U.S. Census Bureau QuickFacts: Franklin County, Washington". www.census.gov. Retrieved November 21, 2025.
- ^ "Find a County". National Association of Counties. Retrieved November 21, 2025.
- ^ "Washington: Individual County Chronologies". publications.newberry.org. The Newberry Library. 2008. Retrieved November 21, 2025.
- ^ "Milestones for Washington State History — Part 2: 1851 to 1900". HistoryLink. March 6, 2003. Retrieved November 21, 2025.
- ^ Gannett, Henry (1905). The Origin of Certain Place Names in the United States. Govt. Print. Off. pp. 131.
- ^ "2025 County Gazetteer Files – Washington". United States Census Bureau. Retrieved November 21, 2025.
- ^ "U.S. Census Bureau QuickFacts: Franklin County, Washington". www.census.gov. Retrieved November 21, 2025.
- ^ "County Population Totals and Components of Change: 2020-2024". Retrieved May 17, 2025.
- ^ "U.S. Decennial Census". United States Census Bureau. Retrieved January 7, 2014.
- ^ "Historical Census Browser". University of Virginia Library. 2007. Archived from the original on December 12, 2009. Retrieved January 7, 2014.
- ^ Forstall, Richard L. (April 20, 1995). "Population of Counties by Decennial Census: 1900 to 1990". United States Census Bureau. Archived from the original on February 19, 1999. Retrieved January 7, 2014.
- ^ "Census 2000 PHC-T-4. Ranking Tables for Counties: 1990 and 2000" (PDF). United States Census Bureau. Archived (PDF) from the original on March 27, 2010. Retrieved January 7, 2014.
- ^ "County Median Home Price". National Association of Realtors. Retrieved November 21, 2025.
- ^ "Franklin County, Washington — Population by Race". CensusScope. Retrieved November 21, 2025.
- ^ "1990 Census of Population: General Population Characteristics Washington" (PDF). www.census.gov. October 6, 2022. p. 30. Retrieved November 21, 2025.
- ^ "P004: Hispanic or Latino, and Not Hispanic or Latino by Race – 2000: DEC Summary File 1 – Franklin County, Washington". United States Census Bureau. Retrieved November 21, 2025.
- ^ "P2: Hispanic or Latino, and Not Hispanic or Latino by Race – 2010: DEC Redistricting Data (PL 94-171) – Franklin County, Washington". United States Census Bureau. Retrieved November 21, 2025.
- ^ "P2: Hispanic or Latino, and Not Hispanic or Latino by Race – 2020: DEC Redistricting Data (PL 94-171) – Franklin County, Washington". United States Census Bureau. Retrieved November 21, 2025.
- ^ a b "2020 Decennial Census Redistricting Data (Public Law 94-171)". United States Census Bureau. 2021. Retrieved 2025-12-07.
- ^ "2020 Decennial Census Demographic and Housing Characteristics (DHC)". United States Census Bureau. 2023. Retrieved 2025-12-07.
- ^ a b "2020 Decennial Census Demographic Profile (DP1)". United States Census Bureau. 2021. Retrieved 2025-12-07.
- ^ "Board of County Commissioners : Franklin County Commissioner's Office". Franklin County, Washington. Retrieved November 21, 2025.
- ^ "Elections (English) : Franklin County Elections Department". Franklin County, Washington. Retrieved November 21, 2025.
- ^ Leip, David. "Dave Leip's Atlas of U.S. Presidential Elections". uselectionatlas.org. Retrieved April 6, 2018.
- ^ Reed, Sam (November 4, 2008). "President/Vice President - County Results". Secretary of State of Washington. Archived from the original on June 28, 2025. Retrieved August 9, 2025.
- ^ Reed, Sam (November 6, 2012). "President/Vice President - County Results". Secretary of State of Washington. Archived from the original on June 28, 2025. Retrieved August 9, 2025.
- ^ Dave Leip. "Gubernatorial General Election Map Comparison – Washington". Dave Leip’s U.S. Election Atlas.
Further reading
[edit]- An illustrated history of the Big Bend country : embracing Lincoln, Douglas, Adams, and Franklin counties, state of Washington. Western Historical Pub. Co. 1904.
- Available online through the Washington State Library's Classics in Washington History collection
External links
[edit]Places adjacent to Franklin County, Washington | ||||||||||||||||
|---|---|---|---|---|---|---|---|---|---|---|---|---|---|---|---|---|
| ||||||||||||||||
Municipalities and communities of Franklin County, Washington, United States | ||
|---|---|---|
| Cities | 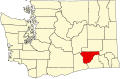 | |
| CDPs | ||
| Unincorporated communities | ||
| International | |
|---|---|
| National | |
| Other | |